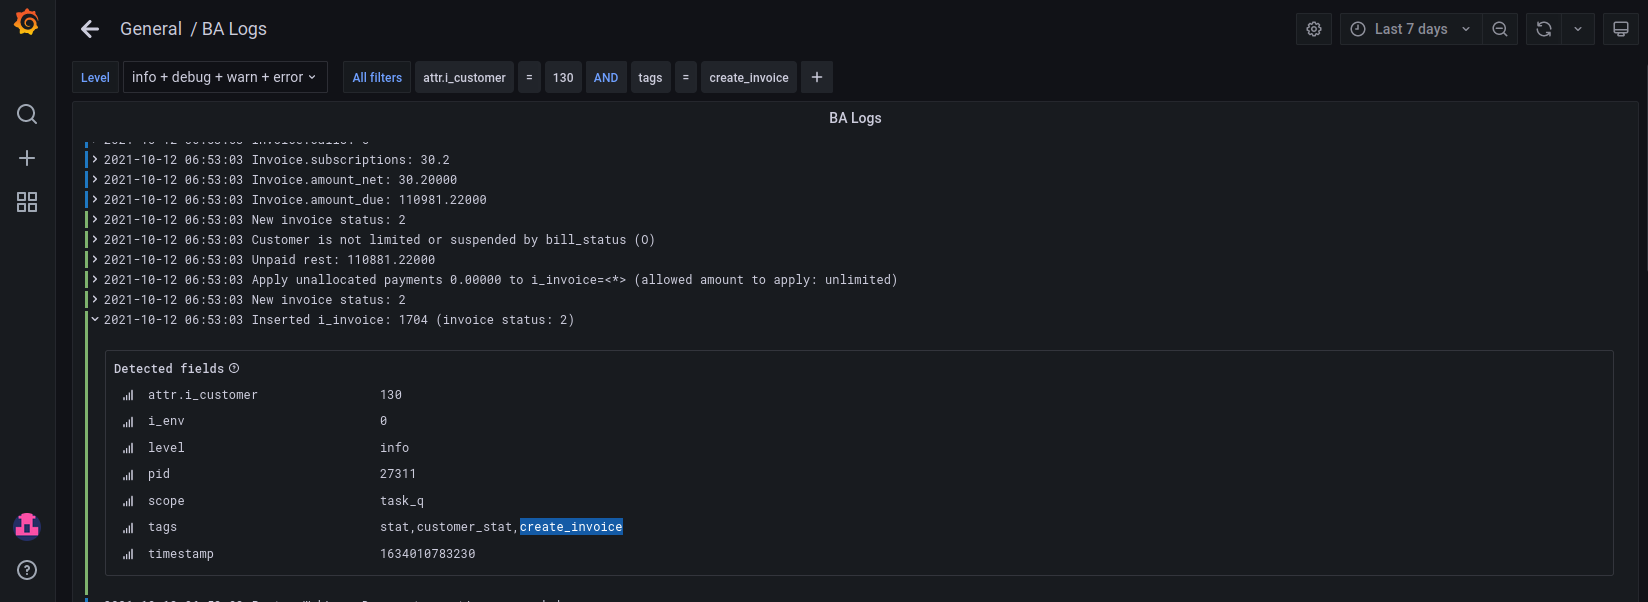
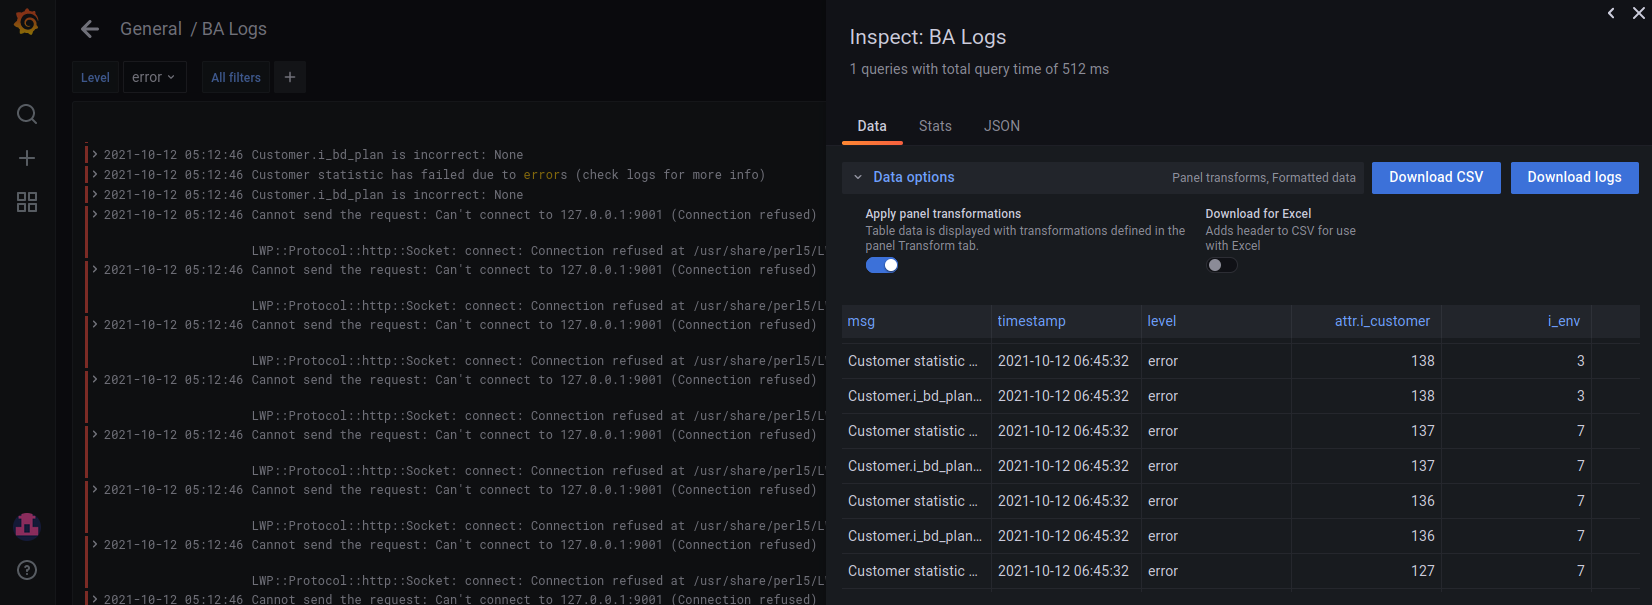
Service providers’ engineers now have an easier way to access and review periodic task logs such as invoice calculation, taxation, periodic payments, and reports. Previously, it took a lot of time to gather the information from text log files, potentially located across several servers. Now, with the integration with Grafana – an open-source platform for data visualization, monitoring, and analysis – a service provider’s team of engineers can access all of them via one web interface.
Grafana is a single entry-point for displaying the periodic task logs (taskstack.log/task_queue.log files) that are collected from all servers and stored in Elasticsearch in JSON format.
Currently, the integration with Grafana allows using a simple dashboard to cover the most common troubleshooting requests: filtering logs, e.g., by customer or environment, reviewing them, and downloading logs in .txt format to submit them to support.
Also, service providers can create their own dashboards, e.g., graphs demonstrating the performance of specific tasks.
Grafana must be deployed on premises. To configure Grafana on your PortaSwitch, contact PortaOne support.
Benefit
- Service providers’ engineers can troubleshoot issues related to periodic tasks faster.


