Open the Configuration server web interface in a browser (https://<configuration_server_name>:8700 by default) and type in the username and password which were provided to you.
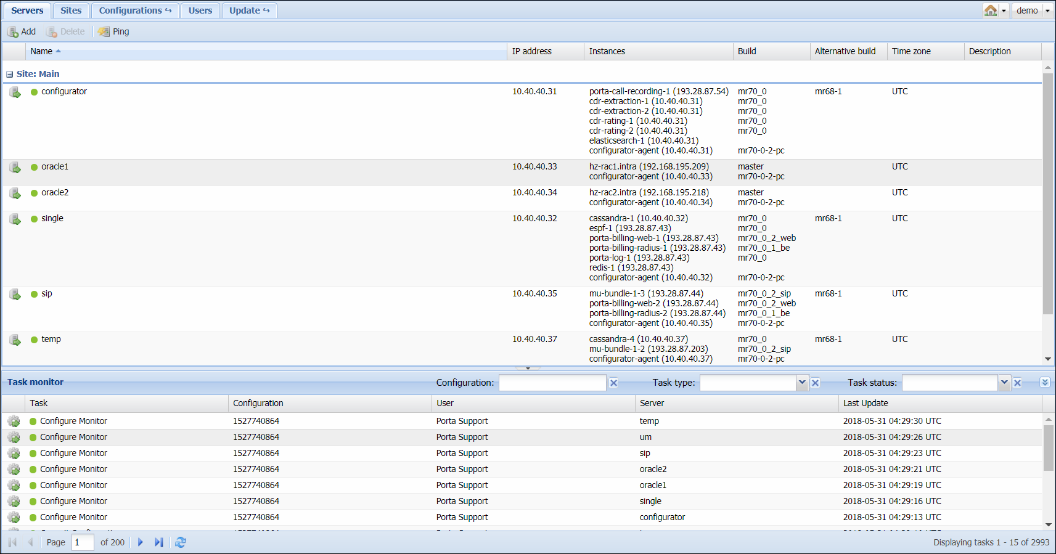
The web interface of the configuration server contains:
- Tab selector
- Action buttons
- Toolbar
- Data table
- Task Monitor
Tab selector
In the upper left-hand corner, there are four main functional tabs and three additional tabs that allow you to manage the different elements of your PortaSwitch system. The main functional tabs are: Servers, Configurations, Users and Update.
The Environments tab becomes visible when you open the Configurations tab.
The Custom, Deposit and UI Plugins tabs become visible when you open the Update tab.
The definitions of and available functionality for each tab are explained in the following sections. Note that not all users have complete access to the entire set of tabs.
Action buttons
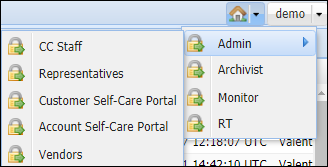
The ![]() Home icon in the right-hand corner contains a menu with shortcuts to all the other PortaSwitch interfaces:
Home icon in the right-hand corner contains a menu with shortcuts to all the other PortaSwitch interfaces:
The Admin button – shortcut to the administrator web interface of PortaBilling:
- CC Staff – customer care staff interface.
- Representatives – interface for sales agents or distributors.
- Customer Self-Care Portal – interface for customers (owners of PBX environments).
- Account Self-Care Portal – interface for account owners (end users).
The Archivist button takes you to the web interface where you can configure backup for the most critical data on your installation.
The BillingAdmin Logs UI button takes you to the Grafana web interface where you can access and review periodic task logs such as invoice calculation, taxation, periodic payments, and scheduled reports.
The Monitor button takes you to the web interface of the monitoring facility for your PortaSwitch installation.
The Portainer button takes you to the Portainer web interface where you can manage available containerized applications.
The RT button takes you to the web interface of the trouble tickets system where you can view your list of requests and perform the needed actions (e.g., close, update or create a new ticket).
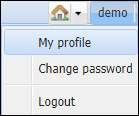
Other buttons in the upper right-hand corner allow you to perform a given action, irrespective of the current context.
The Change password button allows you to change the password for the current user.
The Logout button terminates your current session on the web interface.
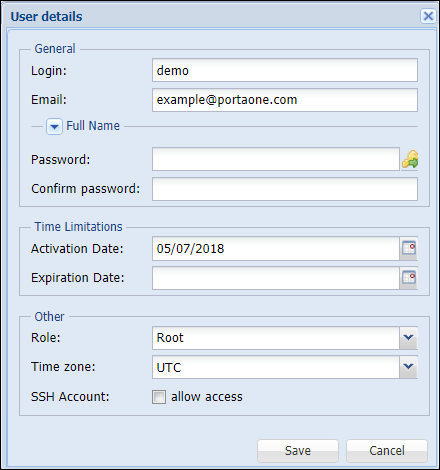
The My profile button allows you to fill in information about the currently logged-in user:
Toolbar
The Toolbar contains buttons that allow you to perform specific operations with the items displayed in the table below.
Item table
The Item Table is your main working area since it contains the items that you will edit.
You can change the number of columns and sort them in ascending or descending order by clicking your mouse on the field name of any of these tabs. If you point your mouse at the column heading you will see a triangle; click on it to see the menu where you can sort items and add or remove columns by selecting or clearing corresponding check boxes.
At the bottom of the page, you can see the task monitor illustrating which tasks were performed. You can see which user performed the task, the server on which the task was performed and the time of the last update. See the Task Monitor section for detailed information.


