You are viewing a document related to an older software Maintenance Release%XX%. Click here to see the latest version of PortaSwitch
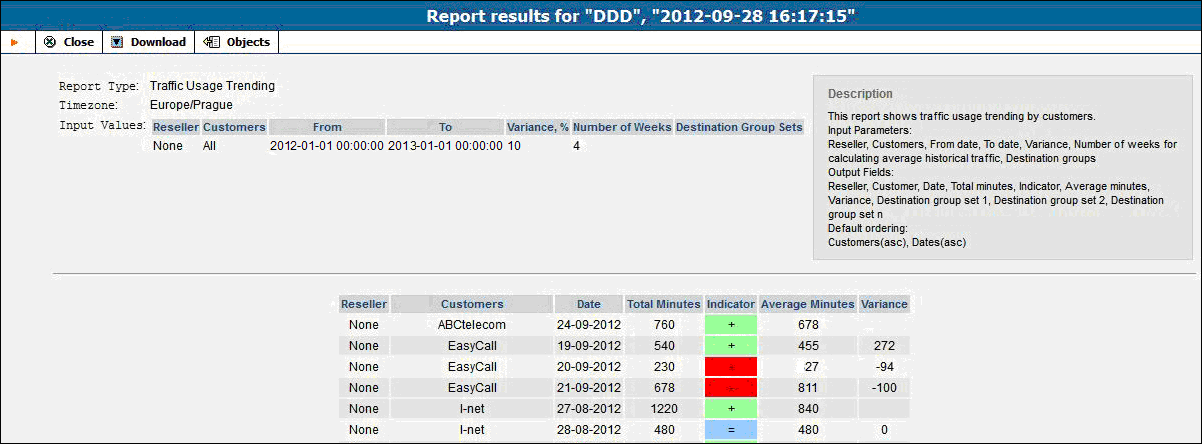
The Traffic Usage Trending report allows you to view selected customers’ daily voice minutes per destination group set. This report evaluates historic data to indicate whether a customer’s voice traffic has gone up, down or remained constant. When the report is configured and generated you will find the following indicators:
Green indicator color demonstrates an increase of Total Minutes over Average Minutes
Red indicator color indicates a decrease of Total Minutes over Average Minutes
Blue indicator color indicates that there was no significant change between the Average Minutes and the Total Minutes
| Name | Mandatory | Range of Values | Description |
|---|---|---|---|
Reseller |
Y |
Existing Resellers |
Whether to generate report for direct customer or specific reseller. |
Customer / Subcustomer |
N |
Existing customers and subcustomers. All by default |
Shows a report for one or more customers depending on what is selected. |
From |
Y |
Date |
The date of comparison used. |
To |
Y |
Date |
A specific date used for comparison. |
Number of Weeks |
Y |
Numeric, 4 by default |
Number of weeks that should be used to calculate Average Minutes. |
Destination Group Sets |
N |
The names of the existing destination group sets |
The choice of one or more destination group sets. If no destination group set is required, select blank. |
Variance |
Y |
Percentage ratio, values from 1 to 100 |
Defines which variance is significant for demonstrating trending changes. For example, if the Variance is 10%, the difference in minutes between two compared days that is greater than 10% signifies a change in traffic, negative or positive. If the values stay within 10% then it is considered to be unchanged. |
| Column | Description |
|---|---|
Reseller |
Reseller’s name. |
Customers |
The name of the corresponding customer. |
Date |
Date in the specified format. |
Total Minutes |
Total daily minutes per customer. |
Indicator |
Green if Total Minutes value is greater than Average Minutes , Red if less, Blue if Total Minutes and Average Minutes values are within the predefined Variance . |
Average Minutes |
Average minutes per customer based on dividing the minutes by the number of weeks (4 by default).
For example: to determine the billing for October 30th, PortaBilling® looks up the total minutes for October 30th, the 23rd, the 16th and the 9th (based the Number of Weeks option). Then the system estimates the average mean for this data, which becomes the value for Average Minutes . |
Variance |
Difference between the two days compared. |
For example, you need to know the statistics for December 2012 and compare them with those from December 2011.
In the Input Parameters tab, specify the reseller and the customer, put January 1st 2012 into the From field and January 1st 2013 into the To field. Let’s use a Variance of 10% and for the Number of Weeks use 4 (the default). This way the minutes for each day of week will be calculated over the previous 4 week’s corresponding days.
Then select one or several destination group sets. If several are selected, then the report will show how much traffic went through each of the destinations in each destination group set. In the Output data tab tick all the check boxes in the Visible column, so that all available information will be included in the report.
Click Save and then click Execute .
To evaluate the Average Minutes and generate a report, the system will look up the avarage value of minutes for January 1st 2013, December 25th 2012, December 18th 2012 and December 4th 2012. The same action will be applied to January 1st 2012: the system will look up and calculate the Average Minutes for January 1st 2012, December 25th 2011, December 18th 2011 and December 4th 2011.
The two values will be compared and depending on the Variance, the appropriate indicator will be applied.
