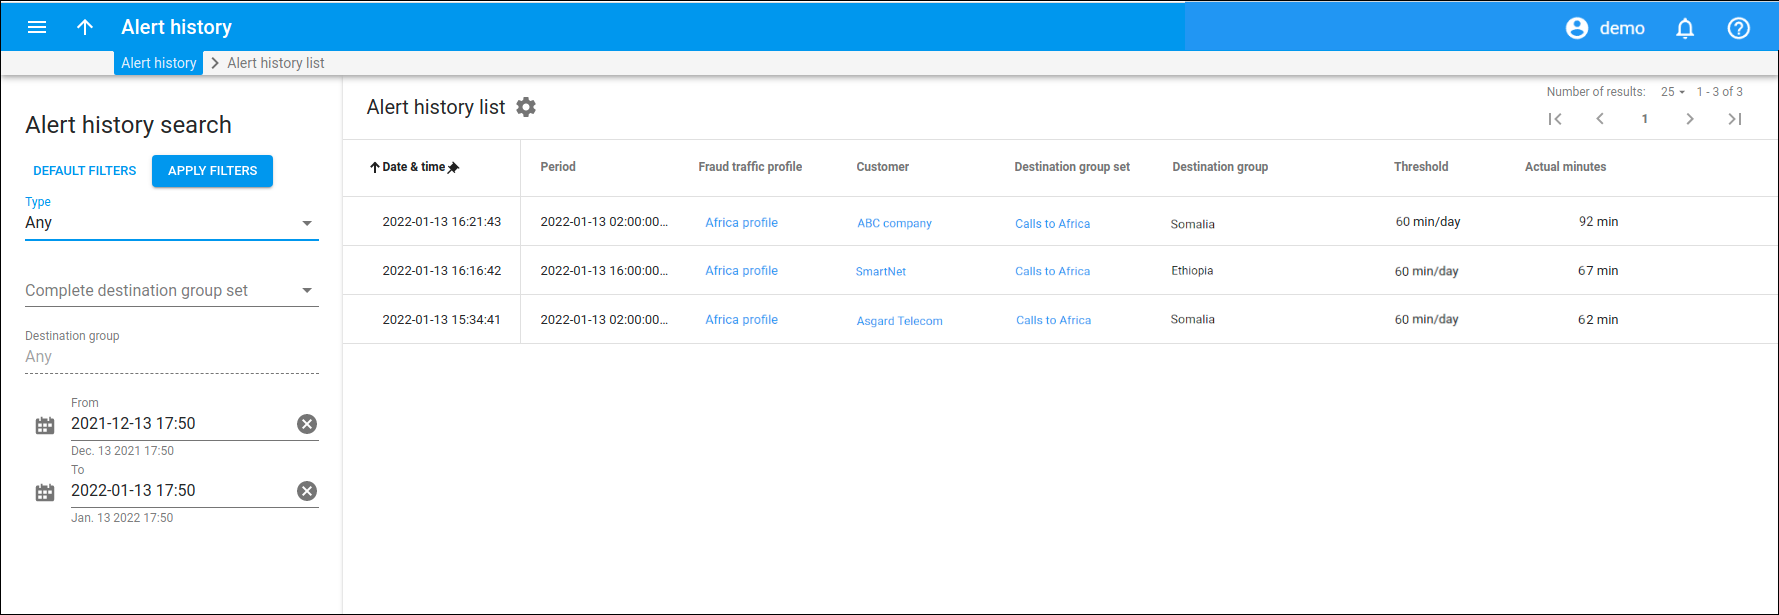
An alert is a notification the administrator receives whenever the volume of voice traffic (in minutes) sent by customers to unusual destinations exceeds the threshold that is set on the Service usage monitoring panel. The alert appears in the Alert history list and is also sent to the administrator’s email.
This panel displays a list of alerts that match your search query.
Each entry in the list consists of:
- Date & time – the date and time when the alert was sent.
- Period – the period of time when the threshold set on the Service usage monitoring panel was exceeded.
- Fraud traffic profile – the fraud traffic profile that is assigned to the customer.
- Customer – the customer that exceeded the threshold that was set on the Service usage monitoring panel.
- Destination group set – the destination group set within which the traffic was used.
- Destination group – the destination group within which the traffic was used.
- Threshold – the amount of traffic that is considered normal during a specific span of time for a specific destination group.
- Actual minutes – the amount of traffic that the customer actually used.
Customize the panel
Link copied to clipboard
- Change table settings – click Settings
in the title bar to customize columns and change row style.
- Re-order the columns – drag-and-drop the column headers right or left to place the columns in the order you want.
- Re-order the rows – click Arrow
(or
) next to the column header to re-sort the rows. For example, the alert records are displayed in chronological order. You can re-sort them in the reverse order.
- Change the default number of results globally – use the Number of results dropdown list in the upper right corner to adjust the maximum number of rows that appear on the panel. By default, the panel displays 25 rows. Once the number is changed, it's automatically saved, so the same number of rows is shown for PortaBilling entities, e.g., customer, account, reseller, etc.


