



In a multi-carrier environment where every termination partner offers different prices for the same destinations, it can be a challenging task to come up with a proper (profitable) price list for your resellers and customers. This is because you have to consider the price of every carrier while deciding how, exactly, to charge end customers. Further, you might use different routing plans for different products, requiring precise pricing in order to avoid losses on cheap calls via expensive premium vendors. So it all seems like a less than easy task. PortaBilling, however, incorporates an LCR blending report tool, which is just what you need for dealing with these issues.
The goal
The ultimate goal is to analyze available routes, calculate the average termination price for each destination, and then use this as a basis for computing the rate for a given customer. The most important step is to “blend” the prices of different vendors according to a realistic scenario. For example, if there are three available carriers for destination 4471, with rates of $0.12, $0.18 and $0.30 per minute, respectively, calculating an average cost (0.12 + 0.18 + 0.30) / 3 = 0.20 would be incorrect, since it assumes that each of these carriers gets an equal share of traffic. Since you are using a real-time routing engine within PortaBilling, you are using least-cost routing and other features so that the cheaper carrier gets more calls, thus increasing your revenue. As a result, the cheaper carrier’s rate has a greater effect on the average termination price.
Therefore, routes are assigned “weight” parameters, where the weight reflects the share of calls going to this route compared to other routes. In our example above, we may assign a weight of 80 to the first route, 15 to the second, and 5 to the third (thus assuming that calls are distributed 80% / 15% / 5% among the three vendors). As a result, the average termination price is $0.138 per minute.
Create a report
- In the navigation menu on the left, select Financial > Reports and click Add.
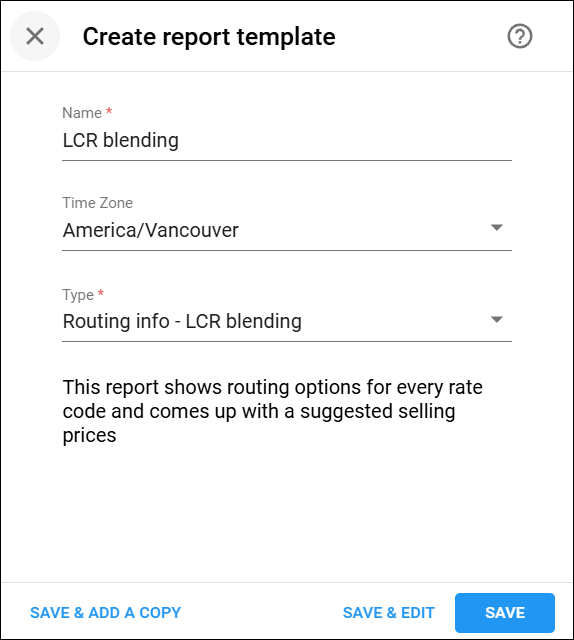
- Fill in the report details on the Create report template panel:
- Name – specify a short name for your report (e.g., LCR blending).
- Time zone – specify the time zone of the report execution. This time zone will be applied to the date(s) in the report execution results and will also appear in the report result filename.
- Type – select the “Routing info – LCR blending” report type from the drop down list.
- Click Save.
Input parameters
Open the created report template, then go to Input parameters and specify the details.
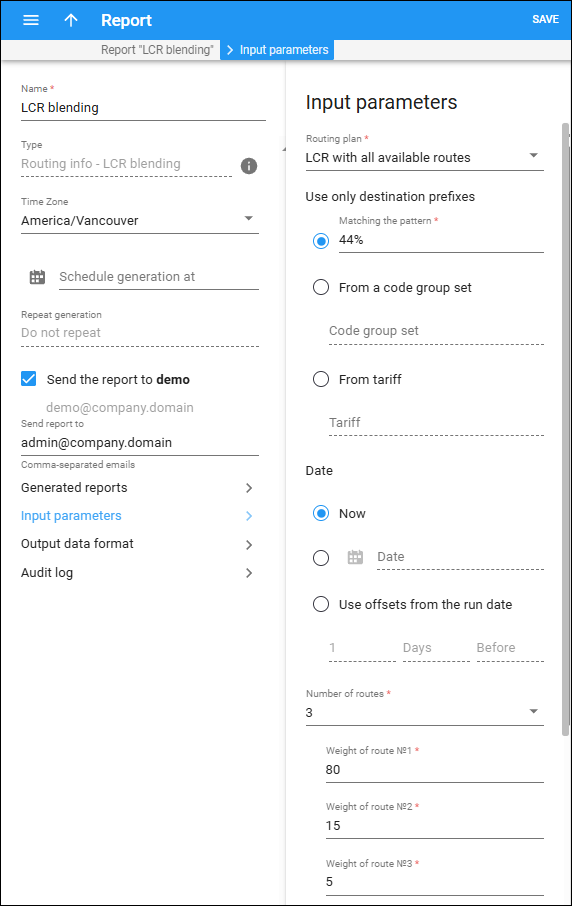
List of input values:
|
Name |
Mandatory |
Range of values |
Description |
|
Routing plan |
Y |
Available routing plans; “All available routes” by default |
Produce a routing list according to the specified routing plan. |
|
Use only destination prefixes |
Y |
Destination pattern |
The available options are:
|
|
Date |
N |
Date + time; by default – empty |
Calculate routing at a specified time (if empty, use the current time at report generation). |
|
Number of routes
|
Y |
Numeric up to 10; default – 3 |
The number of routes (from all available routes) that should be displayed for each destination. |
|
1st route weight |
Y |
Numeric |
How often this route is used, e.g., if the first route has a weight of 80 and the second, 20 – we can assume that, on average, 80% of all calls go via the first route. Weight is not a percentage; rather,
it is the number of calls that go via this route during the sampling
interval. So if you enter 7 for the first route, and 3 for the second, it
means that, on average, for every 10 calls, 7 will go via the first route and
3 will go via the second (or 70 / 30% split). Of course, you can
enter the actual percent values here; e.g., in this example, you can reach
the same result by entering 70 and 30.
|
|
Nth route weight |
Y |
Numeric |
Same as above, for 1st route weight field. |
|
Protocol |
Y |
Available protocols, SIP by default |
Selects the routes that operate via the specified protocol. |
|
Currency |
Y |
List of “available” currencies (base + ones with a defined exchange rate) |
By default, the base currency should be selected. |
|
Selling rate markup, %
|
N |
Numeric, can be negative; by default, empty (0) |
Percentage to be added to the average vendor destination price as your profit. |
|
Compare with Tariff |
N |
List of available tariffs; by default, empty |
The list produced and its price will be compared with the selected tariff (use only if you need to compare the result with some existing tariff; if not, leave this blank). |
Output data format
To configure the output fields, go to the Output data format panel.
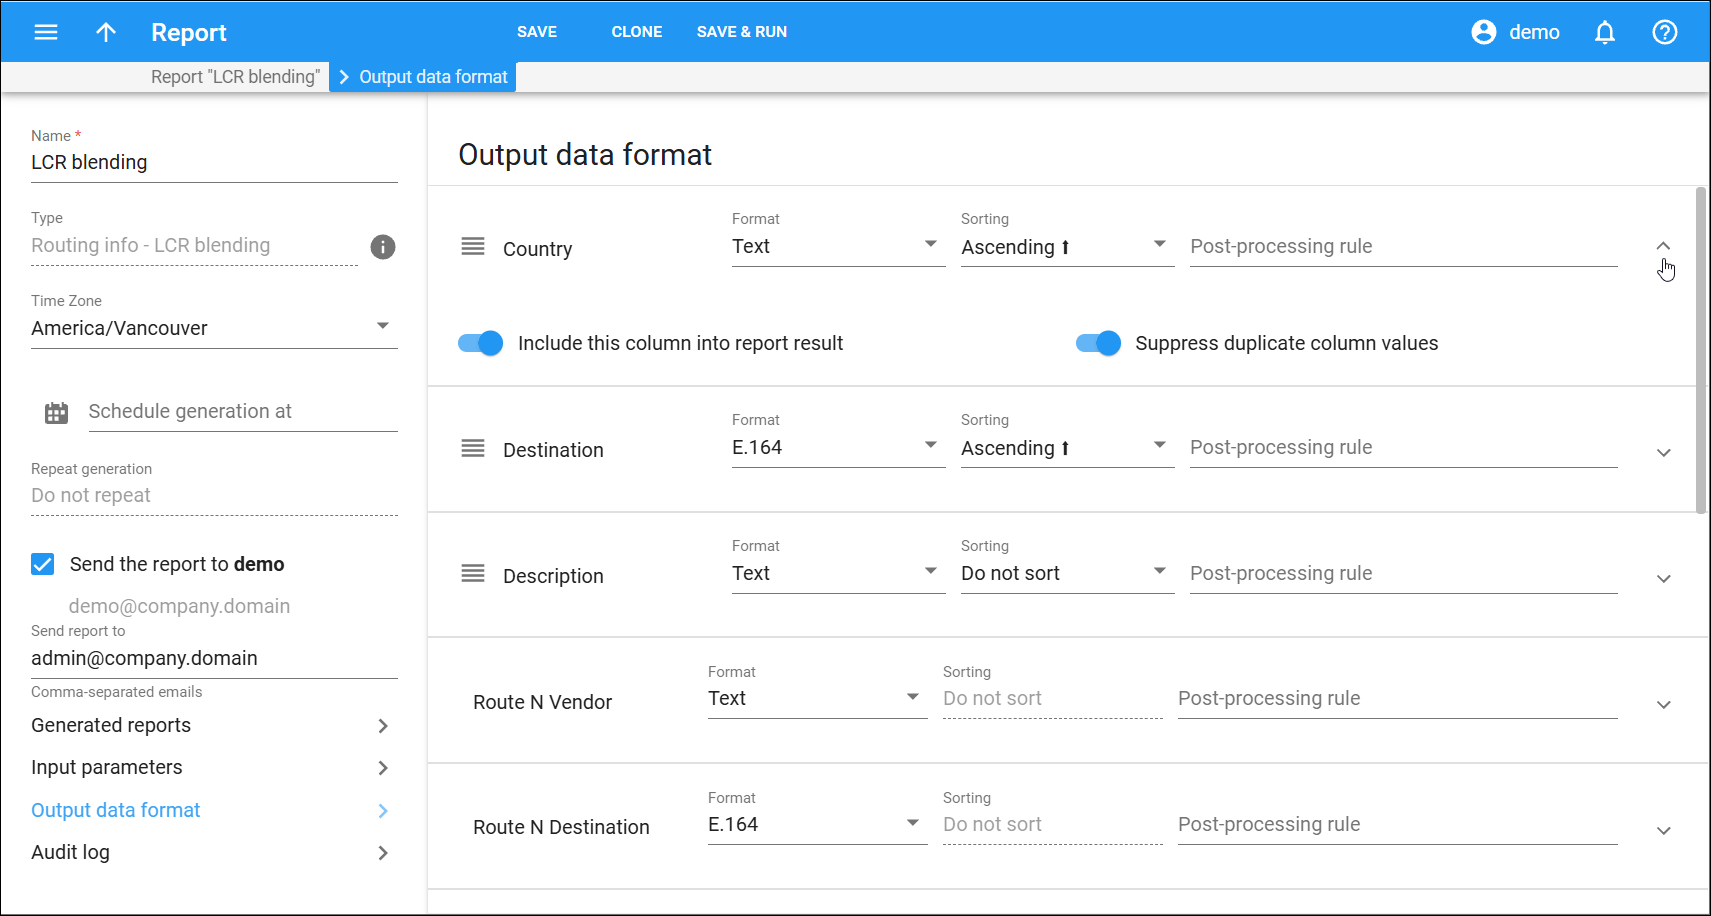
List of output fields:
|
Column |
Description |
|
|
Destination |
Phone number prefix of the destination. |
|
|
Country |
Country corresponding to the current destination. |
|
|
Description |
A short description of the specified destination. |
|
|
Route N vendor |
The name of a vendor for a selected route. |
|
|
Route N price |
The price a vendor charges you for a particular destination. |
|
|
Route N, % |
The route weight, i.e., how often this route is used. |
|
|
Aggregated Price |
Average price to the specified destination. |
|
|
Suggested Sale Price |
Suggested price calculated in accordance with the selling rate markup. |
|
|
Tariff Rate Code |
The rate code in the tariff that was chosen for comparison. |
|
|
Tariff X price |
The price for this rate code in the specified tariff. |
|
|
Tariff <X> difference |
Difference between “Tariff_x_price” and the suggested sale price. |
|
Schedule report generation
You can schedule a report to be generated at a specific date and time. Additionally, you can configure report generation as a recurring task with daily, weekly, or monthly intervals. For example, you can schedule the report to run every Friday at 1:00 PM so that, by the time your weekly meeting is over, the report has been compiled and is ready for review.

To schedule report generation:
- Schedule generation at – click Calendar
 to select date and time.
 - Repeat generation – select the required period for the report execution (e.g., Weekly).
 TIP: You can
monitor the process of report generation. The status of report generation will
be reflected in the /porta_var/<your_domain>/log/httpd-error-web.log.
TIP: You can
monitor the process of report generation. The status of report generation will
be reflected in the /porta_var/<your_domain>/log/httpd-error-web.log.
Click Save to execute the report at the scheduled time. After the report is successfully generated, it is sent to the email address specified on the user page of the report creator. To prevent the report from being sent to this address, clear the Send the report to [user login] checkbox.
To send the report to other recipients, enter their email addresses in the Send report to field, separated by commas.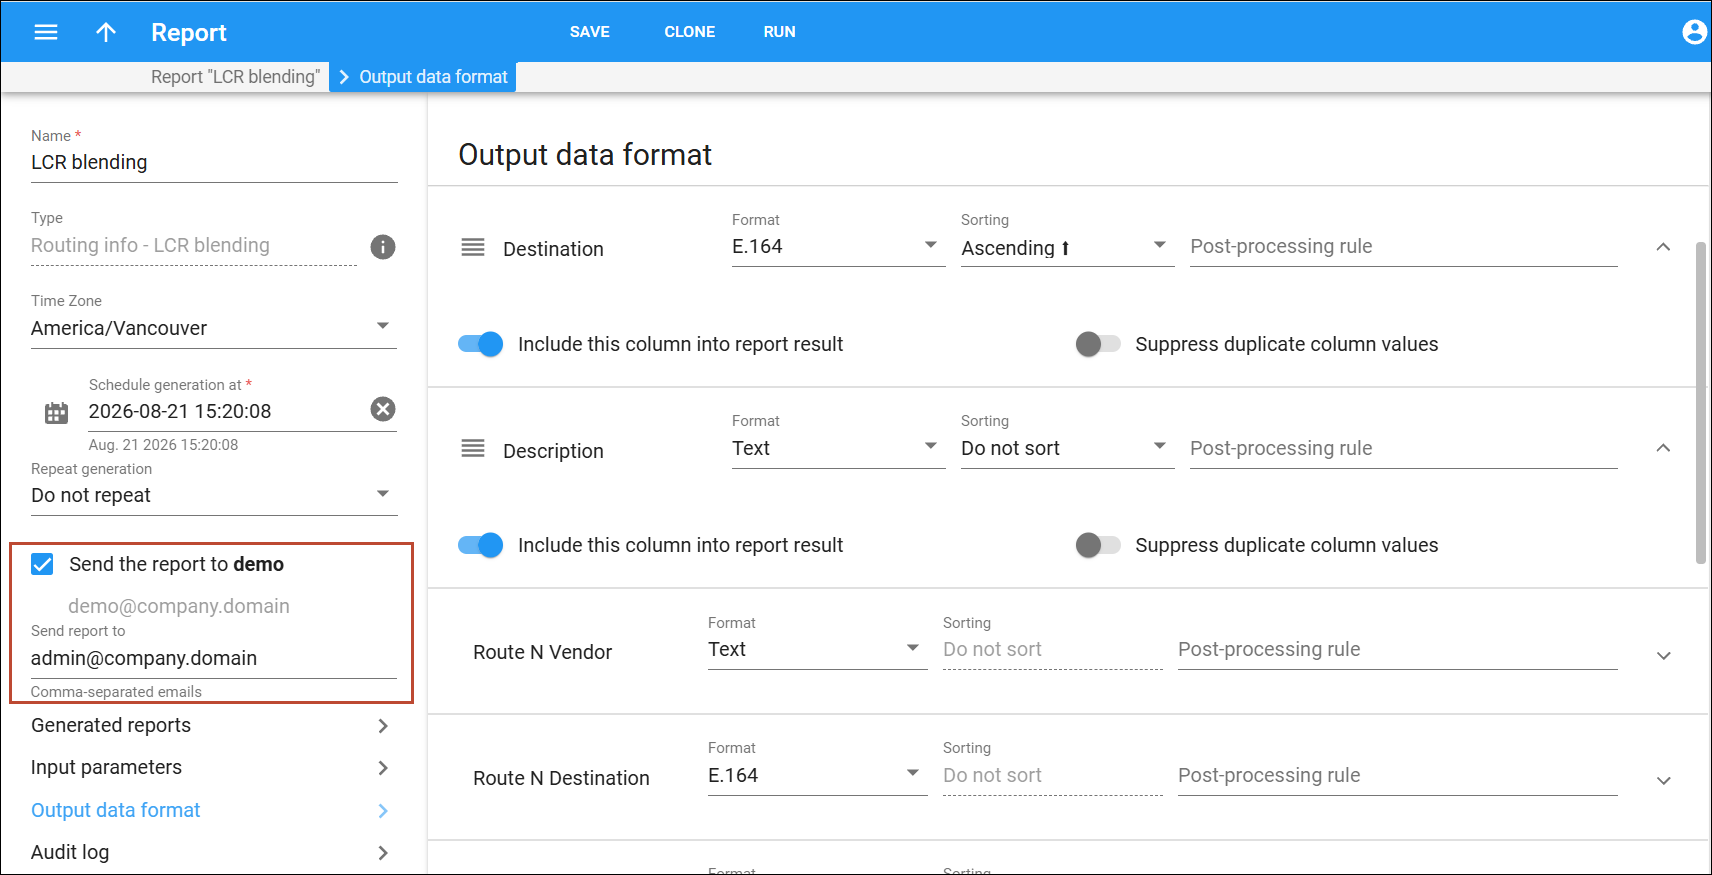
Generated reports
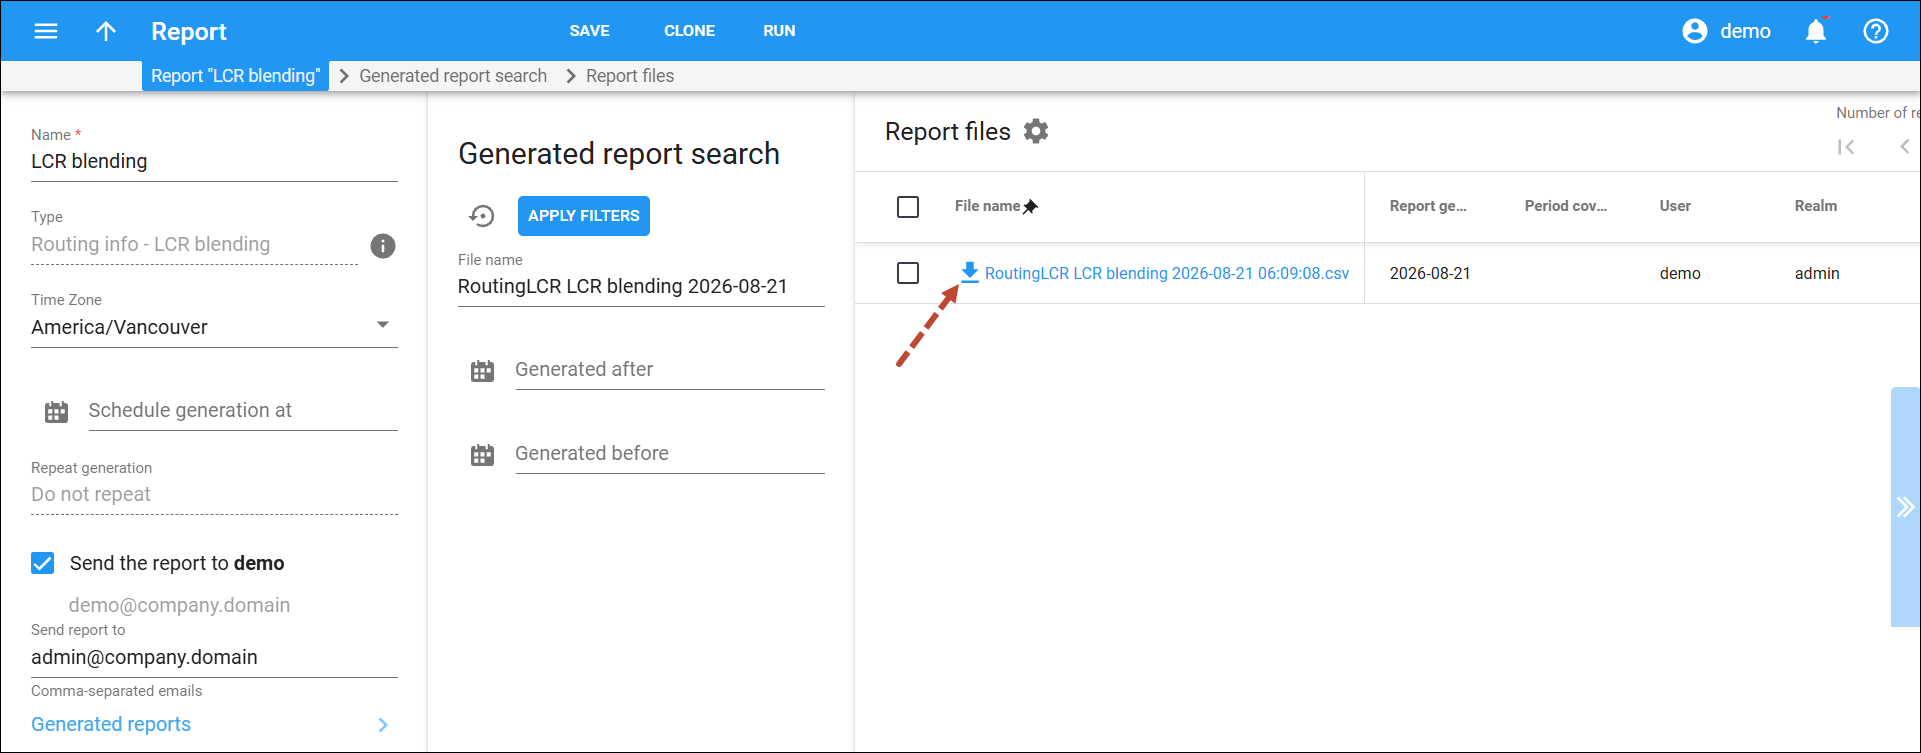
Go to Generated reports to find a specific report file stored in CSV format. Specify one or more search criteria in the Generated report search panel and click Apply filters. The list of files that match your search criteria is displayed in the Report files panel.
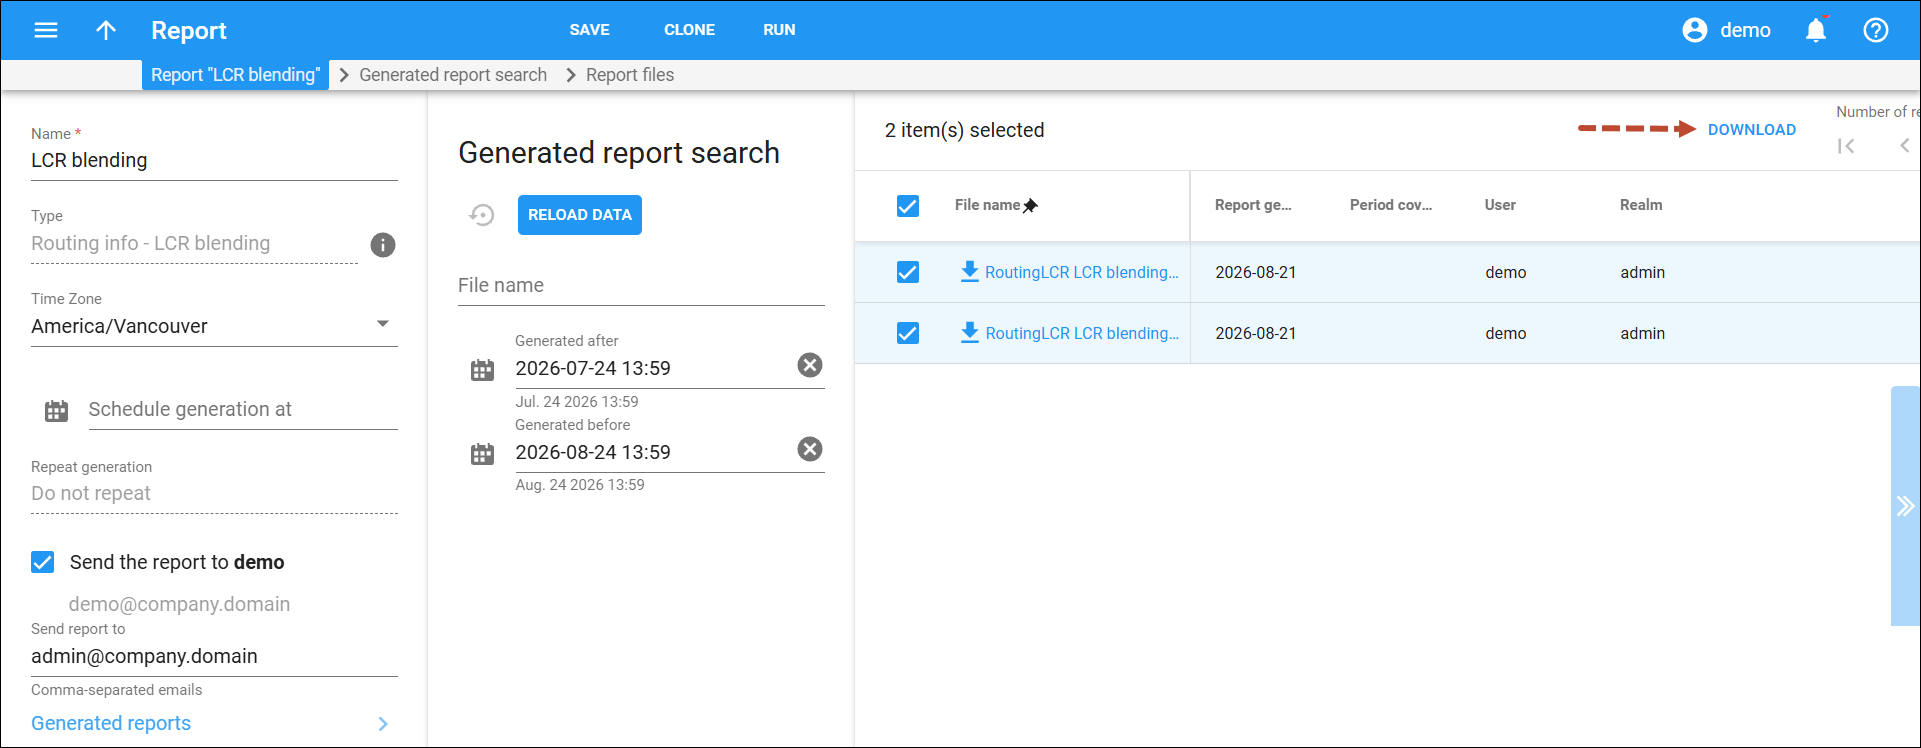
You can download one or several report files. Click Download  to download a specific report or select
several reports and click the Download
button on the toolbar.
to download a specific report or select
several reports and click the Download
button on the toolbar.
How the LCR blending report works
How are all the things mentioned above compiled into a human-readable report? Let’s assume we are generating an LCR blending report for all available routes where the “Destination pattern” is 44 (Great Britain), “Number of routes” is 2, and “1st route weight” is 80% (or just 80) while the “2nd route weight” is 20%.
The system finds all the vendors who can terminate a call to the destination defined in the report parameters. Prices from all matched vendors’ tariffs with a rate code like 44% are retrieved and processed in accordance with defined “route weights” for each available vendor.
The next step is to calculate the average price for all the vendors involved. In our example, 8 out of 10 calls will go to the 1st route (we set its “weight” at 80%). Then all the gathered data is analyzed and the average price is calculated. The 1st vendor’s price will have the highest “priority” in the calculations, to reflect the fact that it will be the most used.
Additionally, the percentage defined as “selling rate markup” is added to the average destination price calculated during the previous step to form the recommended selling prices for each destination that matches the 44% pattern.
The final step is to display the prices of an existing tariff next to the new ones produced by the LCR blending report (if you have specified a tariff for comparison when configuring the report).
When & how to use
New routing plan created
One example of a case in which this report is applicable is when you have created a new routing plan for premium customers, and need to generate a price list to bill for the calls accordingly. For providing services to the most demanding premium customers, you will most likely be using a special routing plan like “Globalcalls.” This will include the most expensive and most reliable vendors with the highest ASR and sound quality. When the new routing plan is ready to use, you will need to have an appropriate tariff & product to make use of it. Please refer to Call routing for more details on how to configure routing parameters and routing plans.
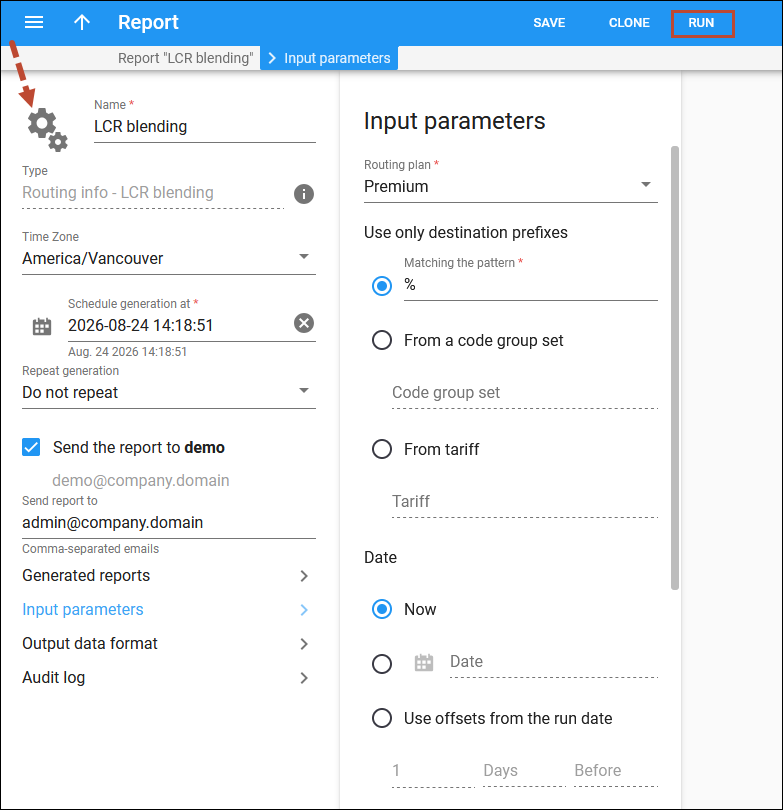
It is then time to start using LCR blending reports. They can save you a lot of time, since recommended prices are generated automatically according to route analysis and routing cost. Open the Report template and enter the appropriate data in all the necessary fields on the Input parameters panel and, if needed, the Output data format panel as well. See the list of Input values and Output values above for a detailed description of all the available fields. As you are not comparing tariffs, you may leave the Compare with tariff field blank. This report will use the following input parameters:
- Routing plan – Premium.
- Use only destination prefixes – matching the pattern “%” (meaning every available destination).
- Number of routes – 3 (there are 3 vendors in the routing plan).
- Weight of route 1 – 80% (you assume 80% of calls will go to this vendor).
- Weight of route 2 – 15% (you assume 15% of calls will go to this vendor).
- Weight of route 3 – 5% (you assume 5% of calls will go to this vendor).
- Selling rate markup – 8% (expected profit margin).
- Currency – US Dollar.
- Compare with tariff – skipped for now.
Click Run on the toolbar to generate the report during the next available periodic task slot. This is a relatively large report, so it may take some time to generate. You can check the report execution status on the Report page.
How to read it
When you created the “Globalcalls” routing plan, you included 3 vendors in it. All of them are prioritized differently; the first one handles the vast majority of calls (since it is first on the list, with the highest priority), while other vendors have the opportunity to terminate a call in case the first one fails to do so for some reason. This first vendor’s info is shown as Route 1 and on the LCR blending report results page, as Route 1 Price. The Route 1 Price will be the basis for the suggested sale price, since you will send about 80% of all calls to it. In spite of possible differences in prices, the Route 2 and 3 prices will have less influence on the resulting sale price, since you will use those vendors mostly as failover solutions.
The results page provides you with a routing and price data overview for each of the 3 vendors. The most important columns are:
- Destination – destination phone prefix.
- Route 1 % – you assume that on average, 80% of calls go via the first route.
- Route N % – you assume that on average, x% of calls go via the Nth route.
- Route 1 Price – price vendor 1 charges you for calls to that destination.
- Route N Price – price vendor N charge you for calls to that destination.
- Aggregated Price – the average price of all vendors combined, with each route’s weight taken into consideration.
- Suggested Sale Price – the aggregated price + 8% (which you have defined as the selling rate markup).
Modifying the report format
As the only intention is to generate a profitable price list and no routing analysis is needed here, you can hide all unnecessary data.
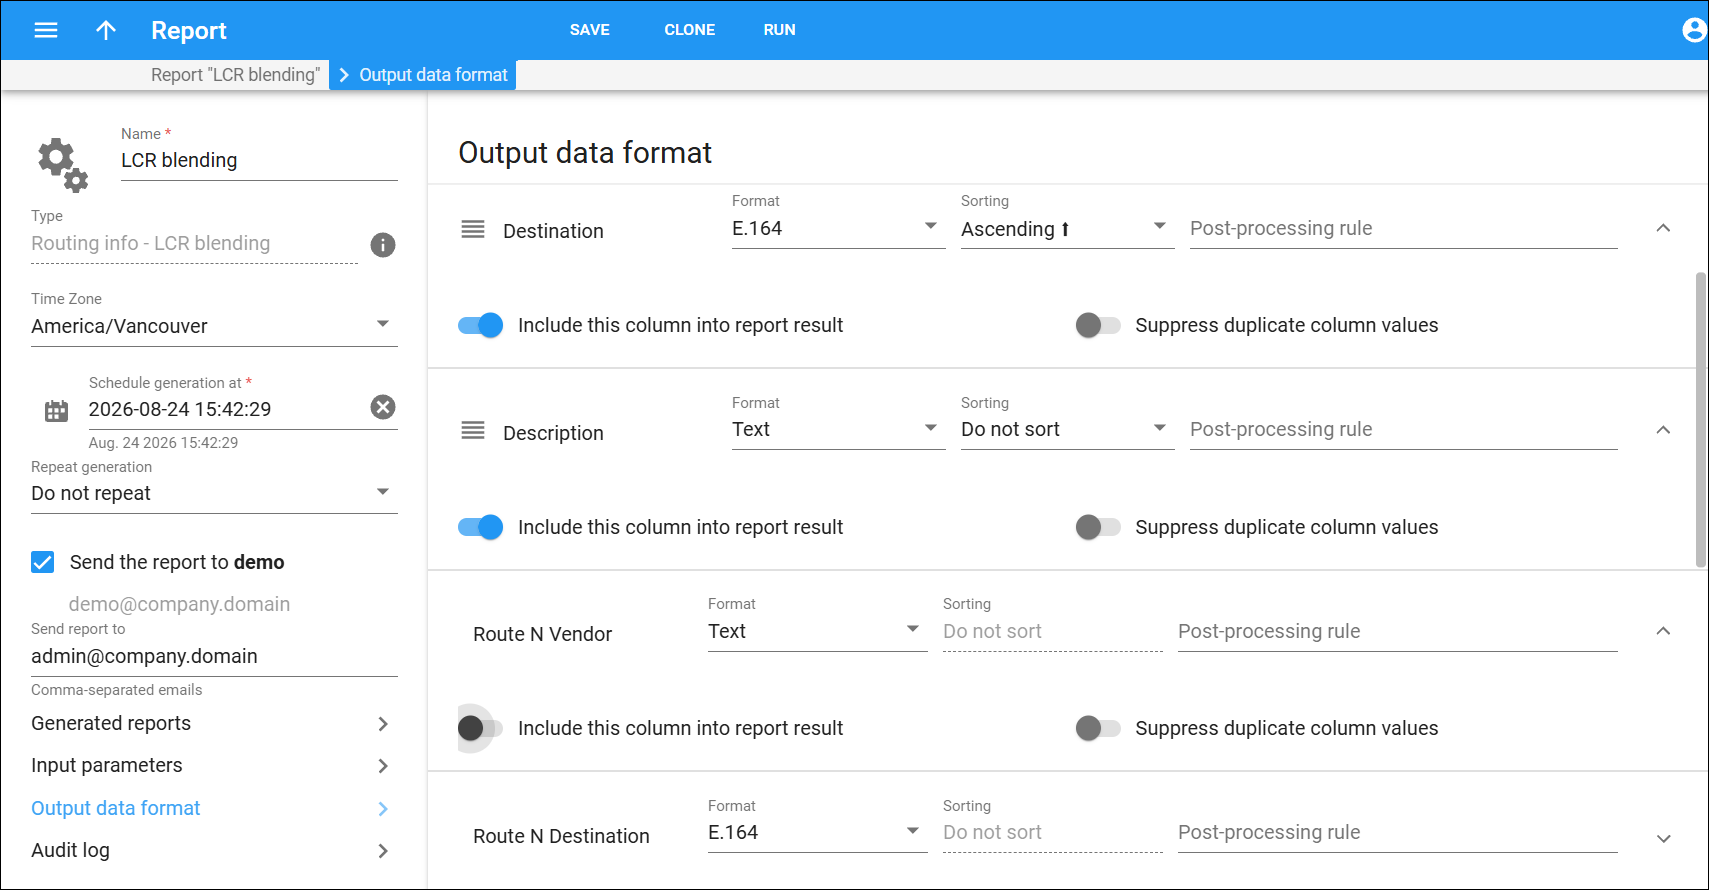
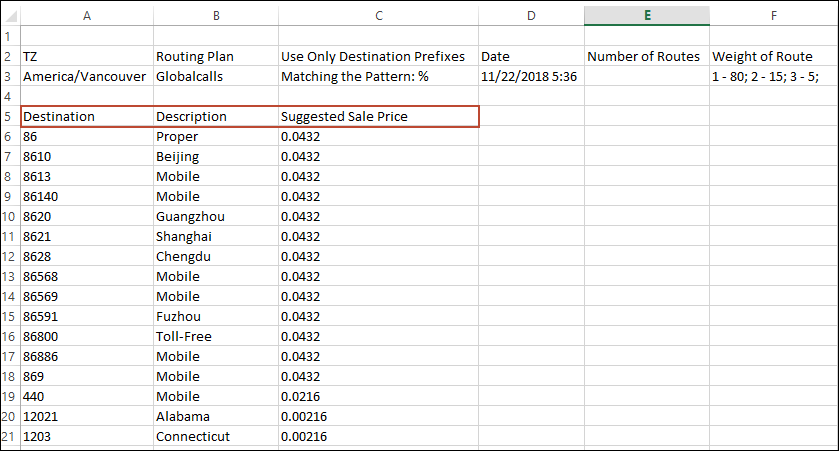
On the Output data format panel, use a toggle to disable the unneeded elements to prevent them from showing up on the results page (in this example, only “Destination,” “Description,” and “Suggested sale price” are left).
There is also a post-processing rule field. Here you can define a Perl regular expression that will rewrite the original values accordingly.
The report results file will look like the following (no extra data, just destination and price):
Quick way to check and redesign existing tariffs
In addition to the information about routes and the suggested price list for the selected routing plan, an LCR blending report can compare its suggested price with a specified existing tariff. It may be helpful to compare your current prices for different end-user groups with those computed with the help of the LCR blending report, and to modify the existing tariffs, if needed.
Before starting the report compilation, simply define the tariff you wish to compare the report’s results to on the Input parameters panel, and then execute the report:
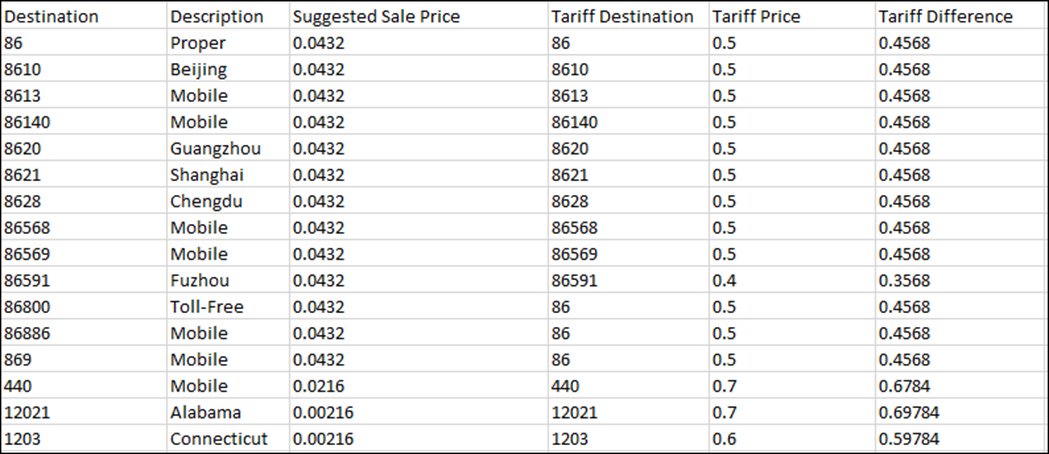
With a tariff defined, the results page will have several new columns:
- Tariff Rate Code – the corresponding rate code in the tariff that was chosen for comparison.
- Tariff Price – the price to make calls to this rate code within the defined tariff.
- Tariff Difference – the difference between the recommended sale price and the current price in the tariff.
Fields like “Route N Price” and “Route N%” have been excluded from this report to give you a clearer view of the new columns on the results page.
Tariff upload
Uploading vendors’ tariffs is not a problem, since vendors themselves provide you with a file containing all the destinations and prices. If this is your own tariff, you will need to create such a file yourself. If the suggested sale price suits you, you can create a new tariff and easily upload the rates for it using a .csv file with report results as a template. Refer to the Rate Import handbook for more information about uploading rates.
Summary
The LCR blending report tool is primarily designed to display routing options for each destination and produce suggested selling prices. It creates a list of available routes for each destination and presents them in a form that allows for easy calculation of “blended” route pricing.


