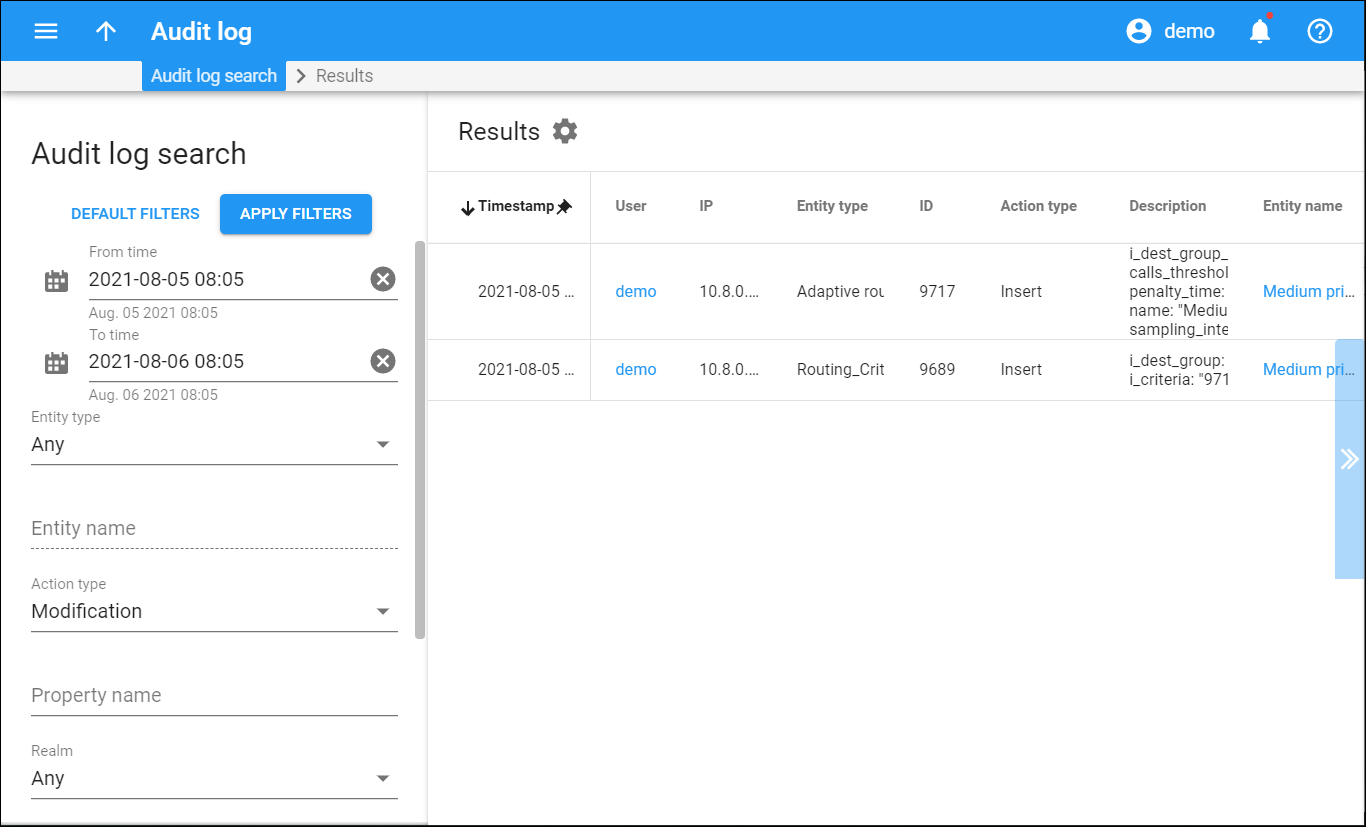
The Results panel displays a list of results that matches your search query.
Each entry in the result list consists of:
- Timestamp – the date and time when the change was made.
- User IP – the name and IP of the user who made the change.
- Entity type – the type of entity the change was made to.
- Entity name ID – the name and ID of the entity the change was made to.
- Action type – here you can check which actions were made to the entity (e.g., Update, Insert or Read).
- Description – here you can check the list of properties that were modified or read with both their old and new values.
By default, audit logs are stored for 180 days in the Elasticsearch storage. You can change the default storage period on the Configuration server (Tasks.Log_Max_Age option).
Customize the panel
Change table settings – click Settings in the title bar to customize columns and change row style.
Re-order the columns – drag-and-drop the column headers right or left to place the columns in the order you want.
Re-order the rows – click Arrow (or
) next to the column header to re-sort the rows. For example, the Audit log list panel displays results in ascending order. You can re-sort them in the reverse order.
Change the default number of results globally – use the Number of results drop-down list in the upper right corner to adjust the maximum number of rows that appear on the panel. By default, the panel displays 25 rows. Once the number is changed, it’s automatically saved, so the same number of rows is shown for PortaBilling entities, e.g., customer, account, reseller, etc.


