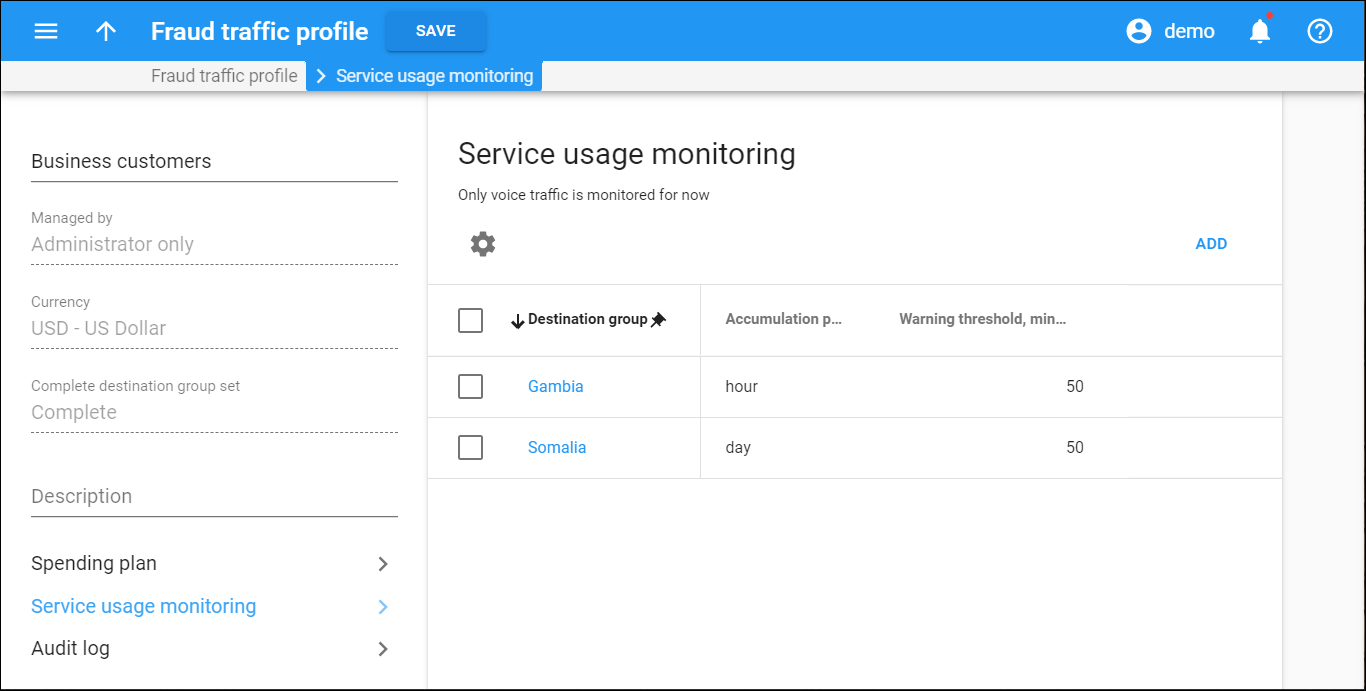
Service usage monitoring allows you to set the expected volume of voice traffic to be sent by your customers to unusual destinations (e.g., Somalia or Albania, while VoIP services are mostly used for the USA and Canada) and receive alerts once a threshold is reached.
This panel displays the list of monitored destination groups. Here you can add/edit/delete a monitored group.
Each entry in the service usage monitoring list consists of:
- Destination group – the destination group to be monitored.
- Accumulation period – this is the period of time for which the Warning threshold is measured, i.e., hour or day.
- Warning threshold – the amount of traffic in minutes that is considered acceptable for the customer during the Accumulation period. If the threshold is reached, it means that an unusual amount of traffic is detected, so the administrator receives an alert.
Add a new monitored group
To add a new group, click Add on the toolbar.
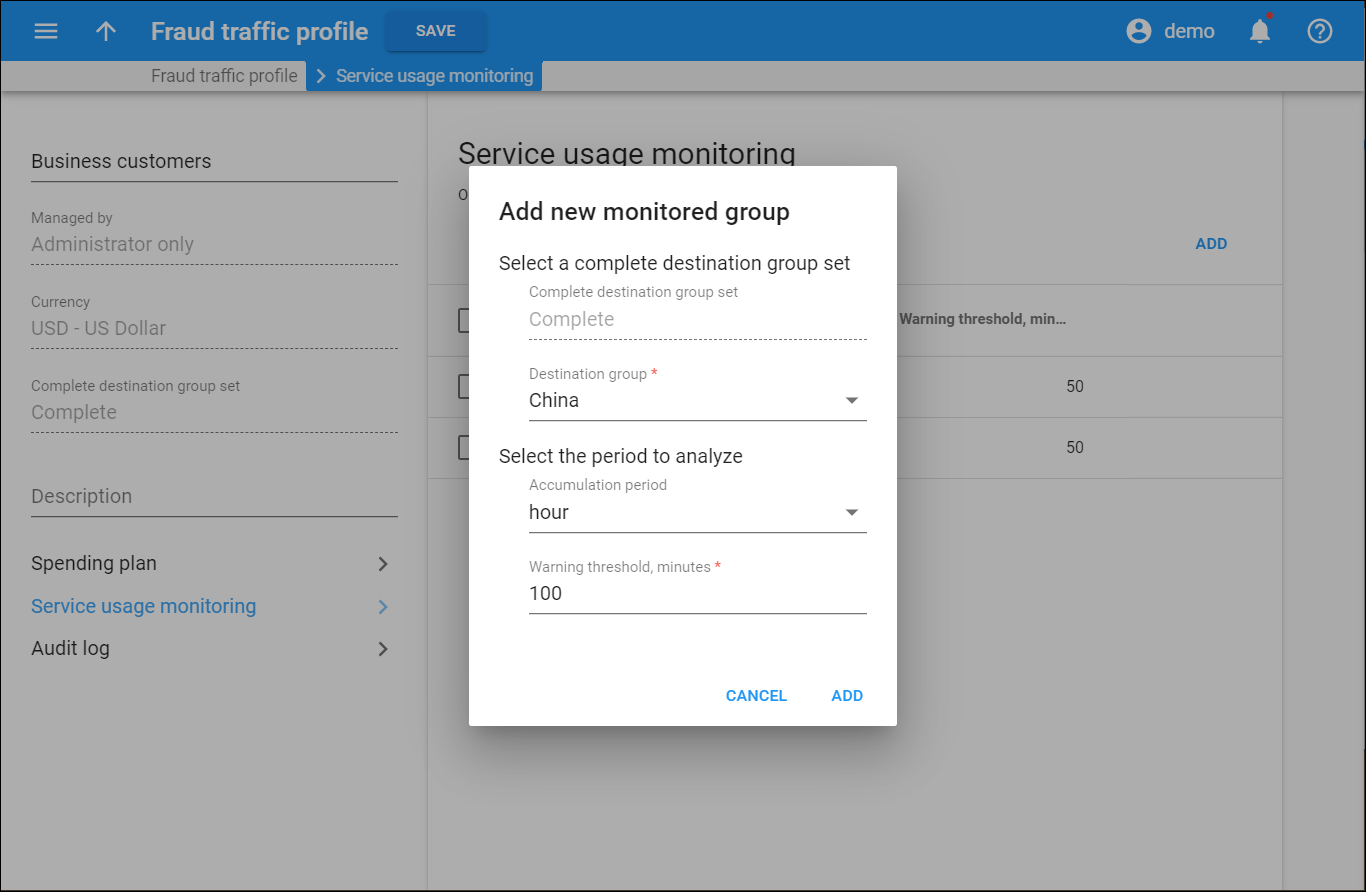
Fill in the details in the dialog window that opens and click Add.
Complete destination group set
Select a destination group set of a Complete type for your fraud traffic profile.
You can’t change this field for saved fraud traffic profiles.
Destination group
Select the destination group within the complete destination group set.
Accumulation period
Select the period for which the Warning threshold is measured – a day or an hour. If the Warning threshold for this period is reached, the administrator receives an alert.
Warning threshold
Specify the amount of traffic in minutes that is considered acceptable for a customer during the Accumulation period. If the threshold is reached, it means that an unusual amount of traffic is detected, so the administrator receives an alert.
Edit monitored group
Hover over the corresponding row in the list and click Edit . You can change the Warning threshold in the dialog window that opens.
Delete monitored group
Select the checkbox next to the needed group and click Delete on the toolbar.
Customize the panel
Change table settings – click Settings in the title bar to customize columns and change row style.
Re-order the columns – drag-and-drop the column headers right or left to place the columns in the order you want.
Re-order the rows – click Arrow (or
) next to the column header to re-sort the rows. For example, service usage monitoring groups are displayed in alphabetical order. You can re-sort them in the reverse order.
Change the default number of results globally – use the Number of results drop-down list in the upper right corner to adjust the maximum number of rows that appear on the panel. By default, the panel displays 25 rows. Once the number is changed, it’s automatically saved, so the same number of rows is shown for PortaBilling entities, e.g., customer, account, reseller, etc.


