



Trace chains of events that affect customer's balance, status, invoice calculation
Administrators can trace the events that have affected a customer’s balance, status, and invoice calculation using the Audit log in PortaBilling. The records have extended descriptions, e.g., “Unallocated payments changed from 10.00 to 70.00 (increased by 60.00). Payments source – from customer payment transaction (xDR id 2204).” This helps administrators find the root of the issue faster when dealing with inquiries from customers.
Let’s say, a customer John Doe receives an invoice for September with an amount of $100 due. John calls the customer service manager to dispute the September invoice. During the call, the customer service manager agrees to reduce the amount due by $30. In two weeks, John contacts the customer service manager again to clarify why he received a notification about an overdue invoice even though he paid in full.
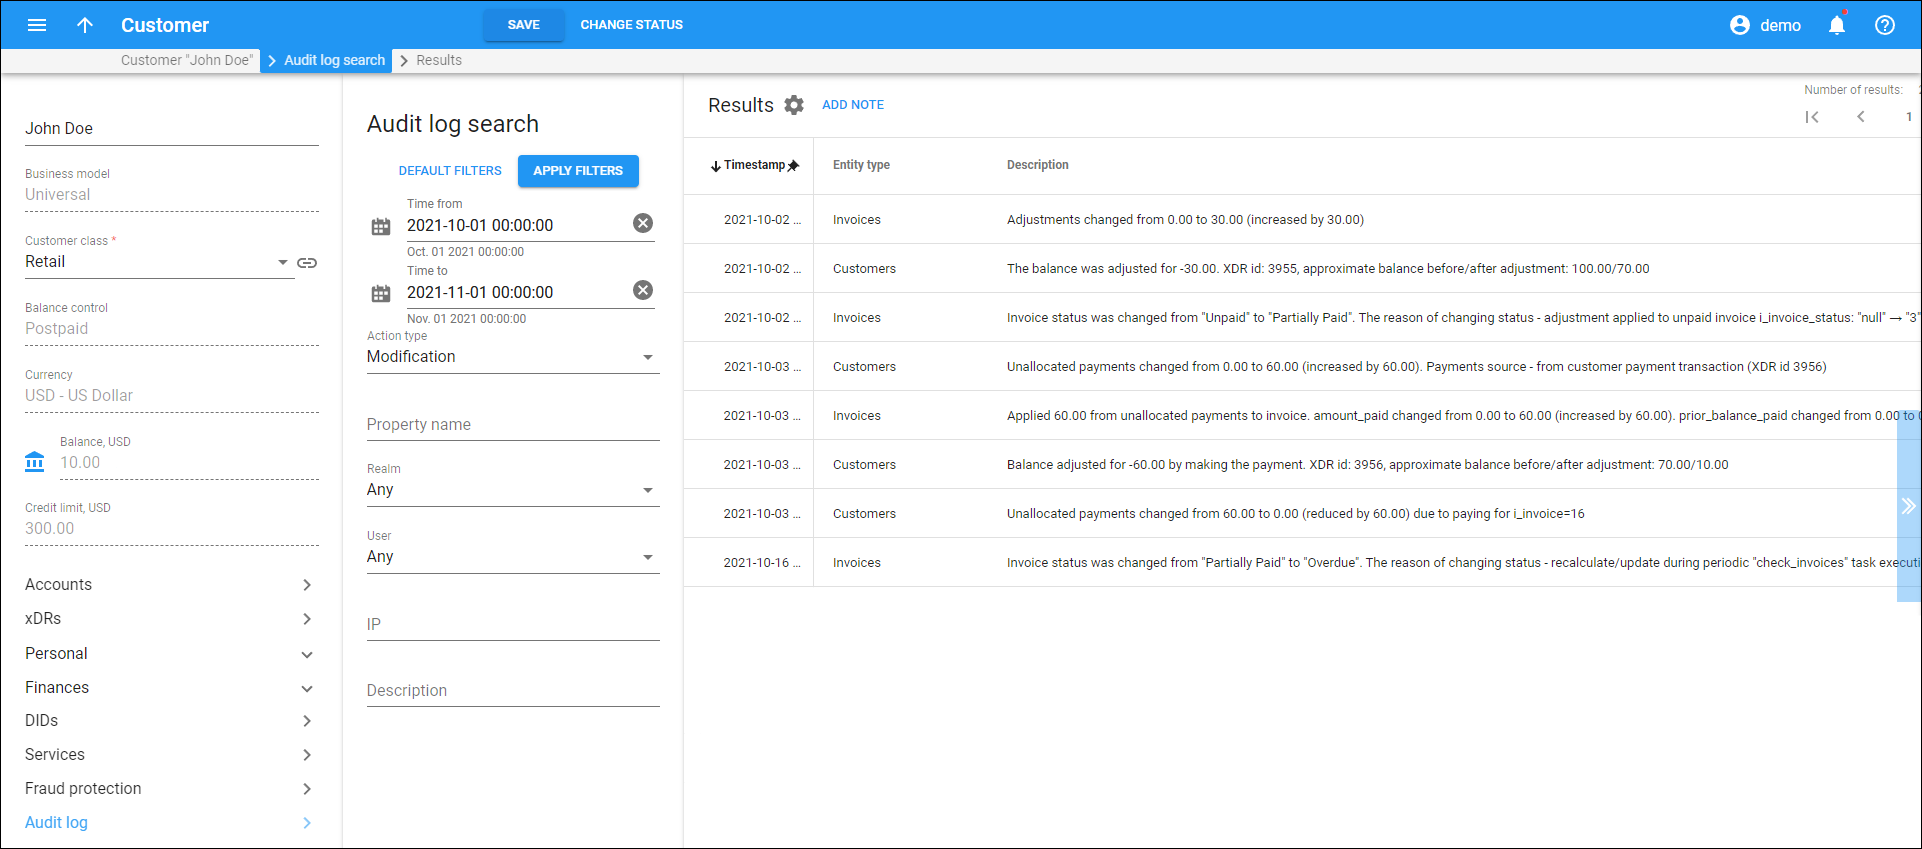
To investigate the issue, the administrator opens Customer > Audit log and filters the records made in October. He finds the record that the invoice was adjusted by $30 and the balance after adjustment was $70. Also, he sees that a $60 payment was made, so the amount due is now $10. No payments were received after that and the invoice status was changed from “Partially paid” to “Overdue”. The administrator decides to check whether the invoice was adjusted correctly. He goes to the CRM system and finds a note about the disputed invoice, confirming that $30 is the adjustment amount that was actually agreed upon with the customer. The administrator calls back the customer to explain that his payment didn’t cover the adjusted invoice amount, so John still needs to pay $10 to cover the invoice in full.
By default, audit logs are stored for 180 days in the Opensearch storage. You can change the default storage period on the Configuration server.
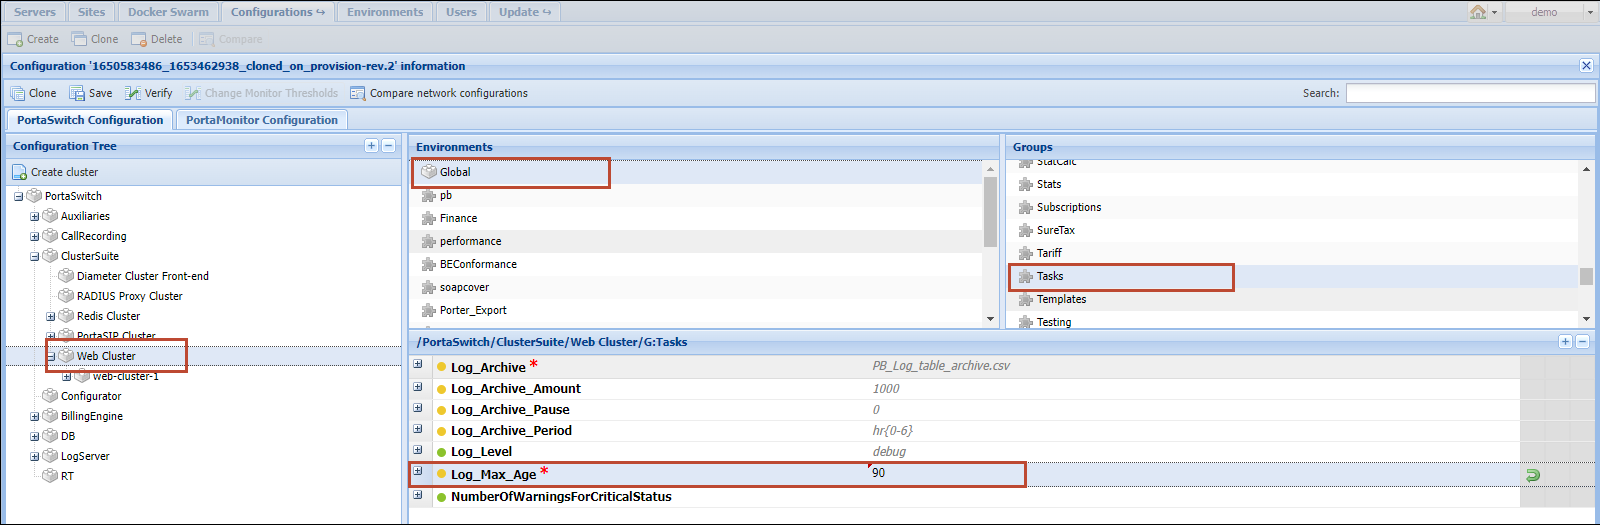
- Open ClusterSuite > Web Cluster > Global environment > Tasks group.
- In the Log_Max_Age option, define a new period in days. The minimum number of days is 30.
- Click Save > Verify > Check/Apply.
Benefits
- Administrators can troubleshoot invoice-related issues faster via the PortaBilling web interface.
Web interface to access periodic task logs
Logs of background tasks, such as subscription charging, tax and invoice calculation, periodic payments, and report generation, are available via the Grafana web interface. This allows service providers’ engineers to view these logs, just as they view the SIP and billing logs for individual sessions in Log Viewer, enabling them to resolve billing issues faster without contacting PortaOne Support.
Grafana is an open-source platform for data visualization, monitoring, and analysis. It serves as a single entry point for displaying the periodic task logs (taskstack.log/task_queue.log files), collected from all servers and stored in Opensearch in JSON format. Using the Grafana web interface, engineers can filter logs and download them as a CSV file. See the handbook for more details.

Also, service providers can create their own dashboards, e.g., graphs demonstrating the performance of specific tasks.
To configure Grafana on your PortaSwitch, contact PortaOne Support.
Troubleshoot periodic tasks faster with unique execution IDs
Engineers can find periodic task logs for a specific customer billing run faster by using a single identifier, instead of combining multiple filters such as customer ID, timestamps, and task type.
PortaBilling generates unique execution IDs for each periodic task run, such as subscription charging, invoice calculation, or taxation. If a task includes subtasks, each subtask receives its own execution IDs. Engineers can use any of these execution IDs to instantly find the relevant logs in the Grafana web interface.

Execution IDs can be taken from the xDR details in the PortaBilling web interface, and Grafana includes a dedicated field for filtering logs by this value.
In the filtered logs, the execution IDs of all related tasks and subtasks are displayed together as a single linked chain (task_ID / subtask_ID / ...). By filtering logs using any execution ID from this chain, engineers can choose the level of detail they need – from a single operation to the entire task run.
For more-in-depth analysis, additional filters, such as searching by message text, can be used.
Owl Telecom’s accountant notices that the subscription charge for one of their customers is less than expected and asks an engineer to investigate.The engineer opens the customer’s xDRs in PortaBilling and locates the subscription charge. They copy the execution ID from the xDR details.

In the Grafana web interface, they paste this ID in the Viewer execution ID filter field.

Grafana displays the log entries related to this specific subscription charge. The charged amount was calculated by the parent task. To see the full calculation process for the subscription charge, the engineer opens one of the log entries, copies the parent task execution ID (one level up), and pastes it in the same filter field.

Grafana then shows log entries for the entire subscription calculation run.
From the log messages, the engineer sees that a 50% discount was applied to the subscription, which explains the reduced amount. The engineer reports this finding to the accountant, resolving the issue without further escalation.
Task Monitor
The Task monitor displays the status of recent tasks and highlights those with a Critical or Warning status. For periodic tasks with these statuses, the Task monitor UI displays the associated execution IDs. If only one task is involved, its execution ID is shown. If multiple related subtasks have errors, the UI displays the first and last execution IDs in the sequence, along with the total error count.
Call emulation tool
You can emulate calls right from the PortaBilling web interface to find out what privacy/identity headers will be passed to a vendor.
You may need to pass the verified caller identity information to vendors in specific INVITE message headers, depending on the local regulations, the equipment capabilities of the vendor, and so on. Using the call emulation tool, you can find the proper combination of PortaSwitch options on the account, customer, and connection level to comply with specific vendor’s requirements.
It’s possible to try different configurations at the SIP message emulation page and check what privacy/identity headers will be passed on in the outgoing INVITE message to a vendor. Thus, you can find the needed configuration faster and reduce time spent on troubleshooting. Once you find a suitable configuration, you can save the changed options right away.
Currently, you can emulate a call between two accounts in your system or a call from account to vendor. Since the outgoing INVITE messages are not sent for emulated calls, these tests don’t affect the regular telephony service. There’s no charging for such calls, either. Thus, you don’t need to create test entities and can make tests using existing accounts/connections. The test call logs are available along with the normal call logs.
If you need to emulate a call with specific headers that are typically received from an external endpoint, you can either add the specific headers manually one by one or copy and paste the full INVITE from a sample log.
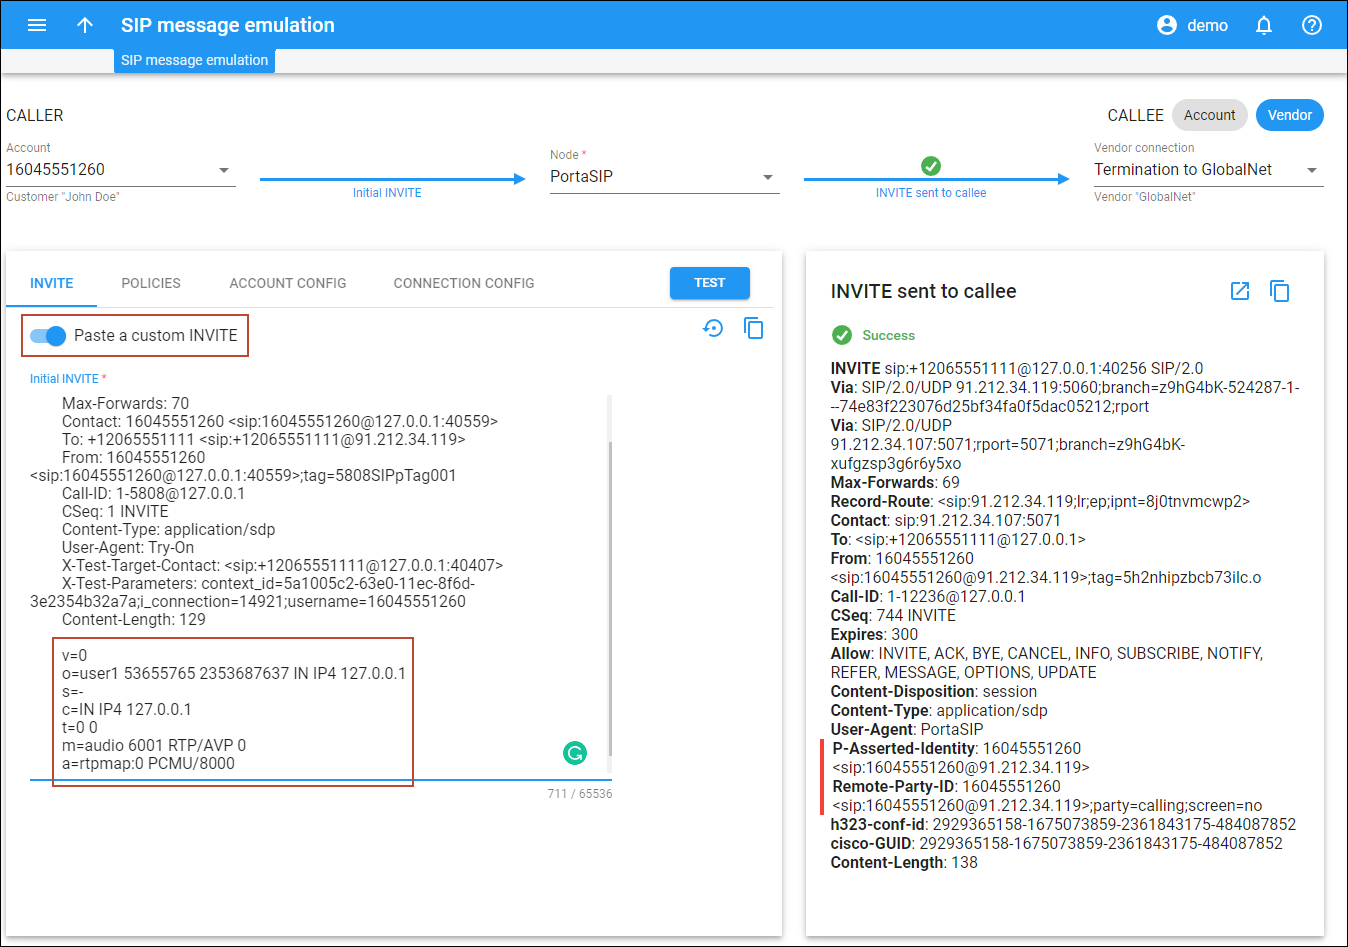
Note that when you paste a custom initial INVITE, the SDP part must be included.
PortaSwitch supports a whole set of options that may impact the privacy/identity headers. They can be configured on the account/customer/connection level and applied via a service policy. You can change all these options for caller/callee right from the SIP message emulation page. After you test the impact of specific options on the outgoing INVITE message, you can save the changed settings for a specific entity.
Benefits
- Faster troubleshooting of identity handling issues via the PortaBilling web interface.
- Shorter time to interconnect with a new vendor.
Let’s consider an example:
GlobalNet, a new vendor of service provider Panda Telecom, requires the caller’s phone number (CLI) in at least one of the following headers: From, P-Asserted-Identity (PAI), or Remote-Party-ID (RPID). Otherwise, the calls are dropped.
Panda Telecom provides their customers with the ability to hide the phone number. Adam, an engineer at Panda Telecom, needs to make sure that in this case the caller’s phone number still will be sent to the vendor. Adam performs the following steps:
- Opens Toolbox > SIP message emulation.
- For Caller, selects the account ID, e.g., 16045551260, in the Account dropdown list.
- Selects a node from the dropdown list.
- For Callee, clicks Vendor and selects a vendor connection in the dropdown list.
- Specifies any CLD for the call emulation in the “To” field.
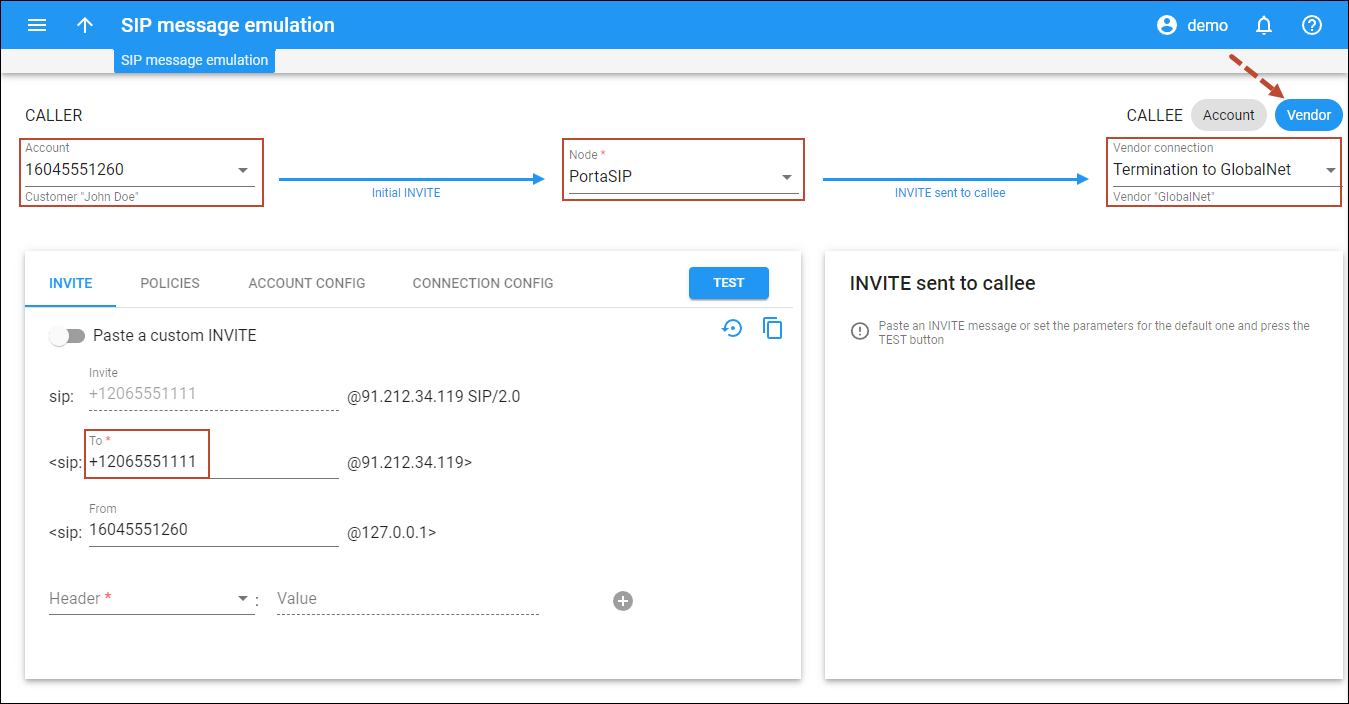 The CLD can be specified in the E.164 format or in a custom format according to dialing rules that are set up for the customer/account.
 - Opens the Account config tab and enables the Hide CLI option for the caller’s account.
- Clicks Test.
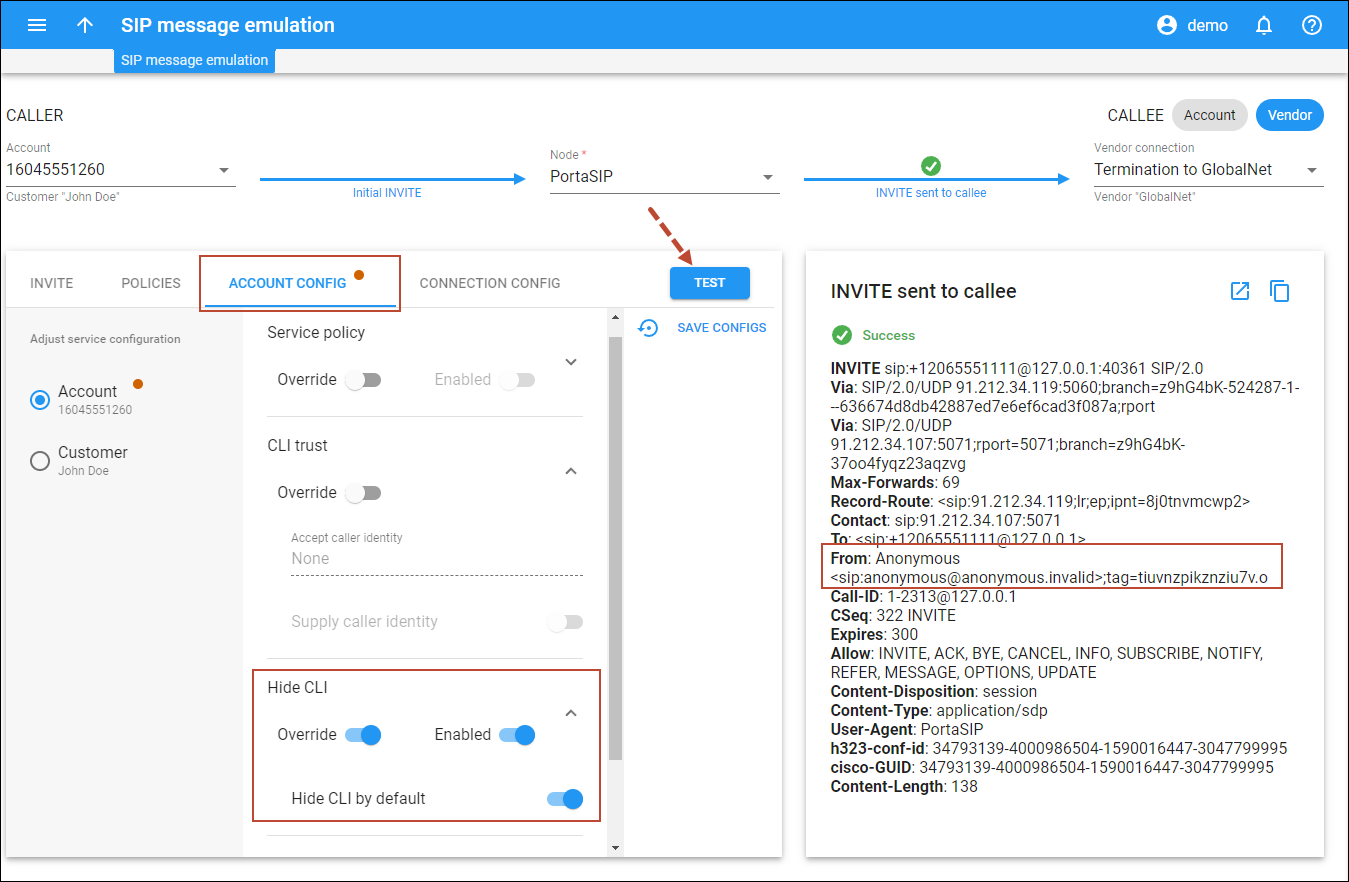
Adam can see that now the account’s phone number is not included in the From header. However, the phone number is not present in either header in the outgoing INVITE message. Thus, the vendor will reject such a call.
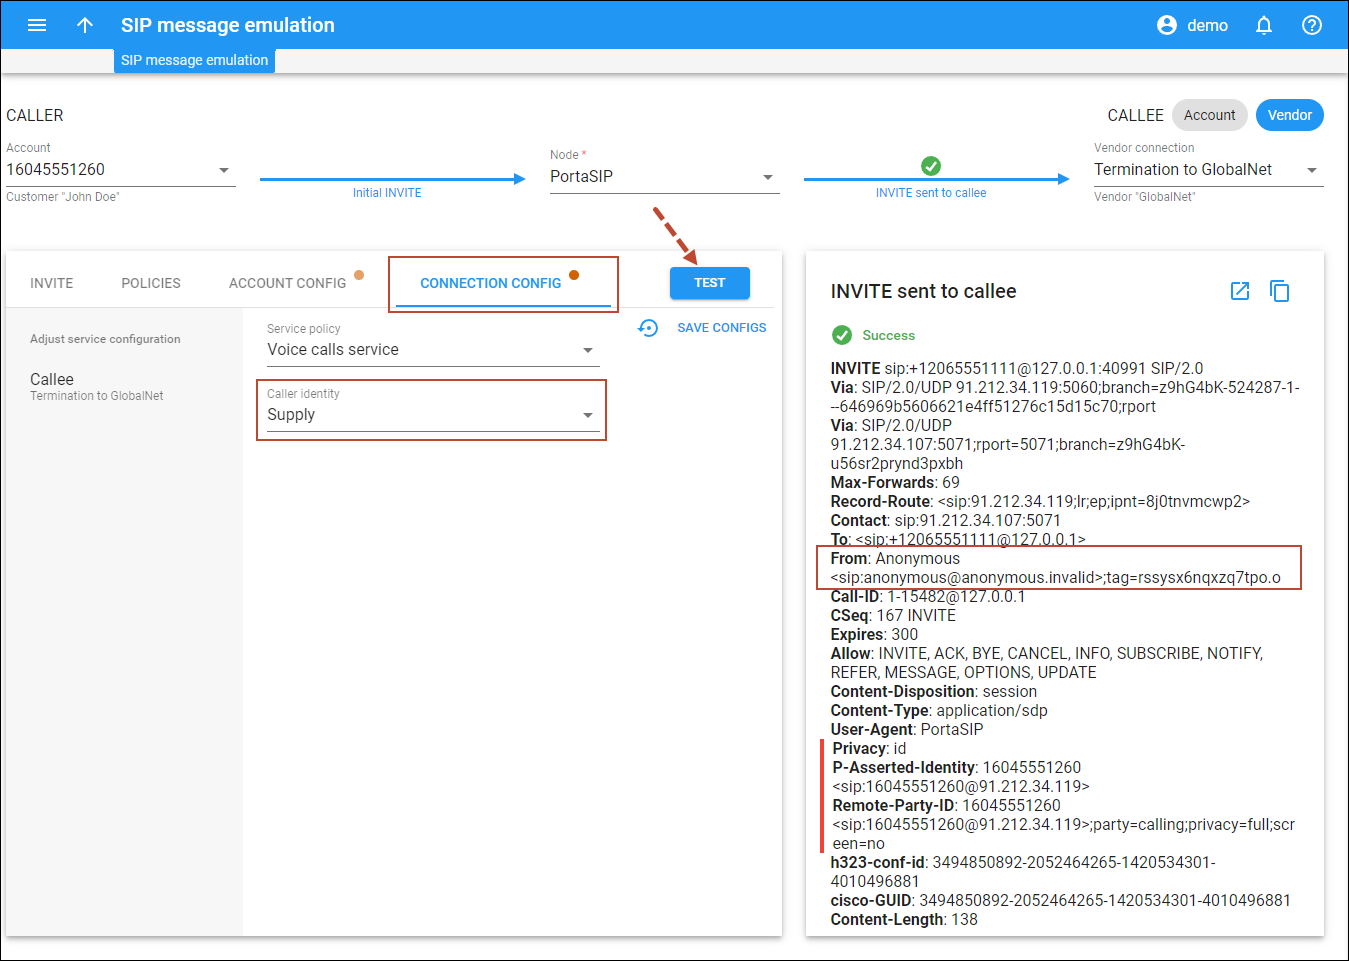
Adam decides to set up the PAI and RPID headers, so the call will be accepted by the vendor. He opens the Connection config tab and sees that the connection is not marked as trusted (the Caller identity option is set to Do not supply). Adam selects Supply instead and clicks Test. Adam can see that now the account’s phone number is included in the PAI and RPID headers. The resulting INVITE message complies with the vendor’s requirements.
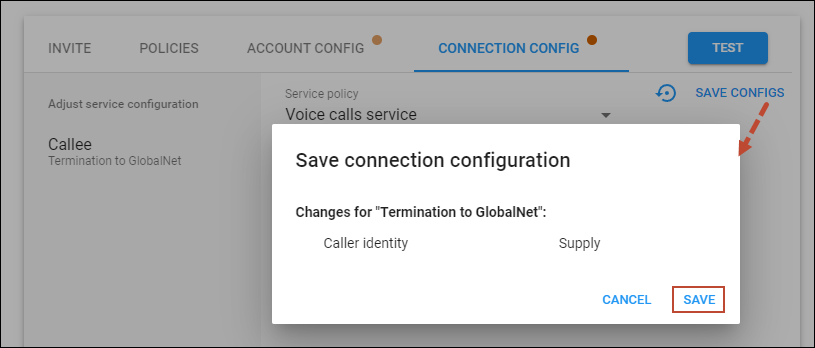
Adam wants to save the updated configuration for the connection right away. On the Connection config tab, he clicks Save configs > Save.
Specifics
- If you save the configuration for a service policy, note that the changes will affect all entities this service policy is assigned to, not only the account/connection participating in the emulated call.
- The configuration is saved on each tab separately. For example, you have changed configuration for the account and the connection. If you open the Account config tab and click Save config, only the changes made for the account are saved.
- The dynamically matched service policies are not considered in the emulated calls. If you use a dynamically matched service policy, it may apply to calls where specific equipment is used. So, the INVITE message in a real call may differ from the emulated one. To consider the impact of a dynamically matched service policy, you can create a static service policy with the same configuration, and apply it to the tested entity.


