PortaOne software comprises a complex system that involves the simultaneous work of several servers or clusters of servers. Such a system requires reliable monitoring that makes it possible to immediately detect any nascent failure and prevent the possibility of negative consequences to the system. The PortaOne monitoring system collects and analyzes data from more than 100 types of indicators from each system and provides monitoring serviceability 24/7.
The PortaOne monitoring system provides the following functions:
-
It continually collects information from each server within the entire PortaSwitch installation.
-
It provides fast detection of failures and informs the support team when a failure exists.
-
It visualizes system performance via graphs.
The PortaOne monitoring system is implemented through Nagios (www.nagios.org) – the industry standard in IT infrastructure monitoring. It offers complete monitoring and alerts for servers, switches, applications and services, and provides many additional plug-ins. The transport of data is realized through Nagios NSCA (Nagios Service Check Acceptor) packages. Nagios ensures a high level of process security and reliability and has been recognized for its efficacy by users all over the world.
PortaOne NSCA-based monitoring
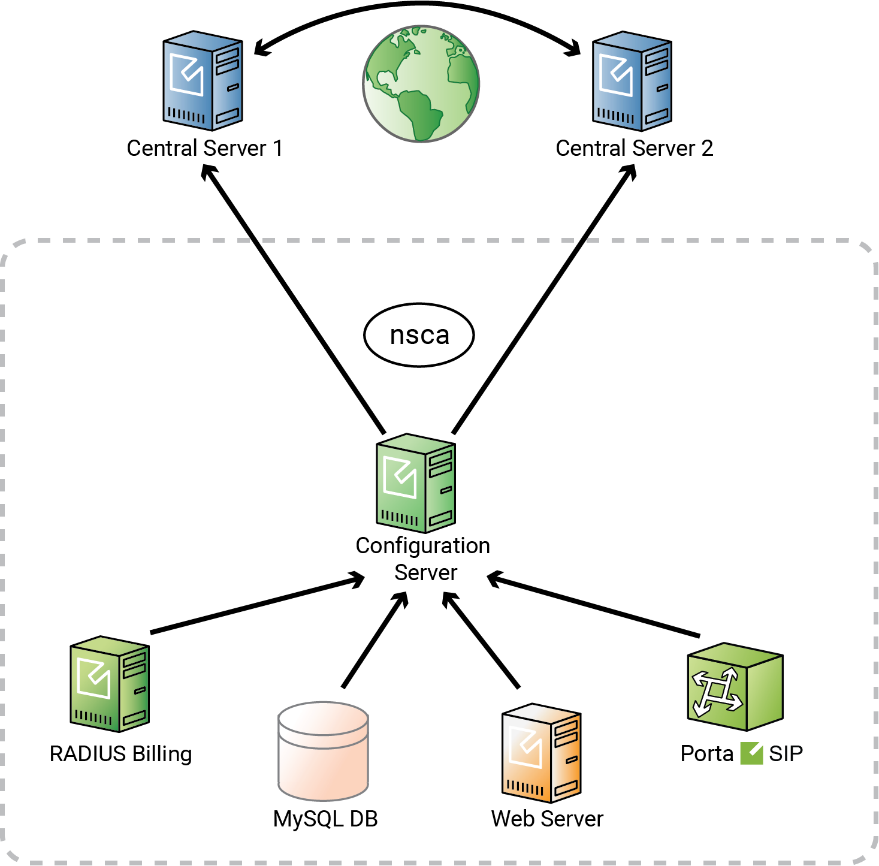
NSCA-based monitoring is used on most customers’ installations. There are three key entities involved in PortaOne NSCA-based monitoring (Figure 1-1):
-
Central Server 1 and Central Server 2 – These servers collect information from the ITSP’s Configuration server about the status of each indicator for further analyses and processing. For security, these PortaOne Inc. servers are physically located on different sides of the globe, while performing the identical work.
-
Configuration Server – This server continually collects monitoring information from all of the PortaSwitch Servers in the installation and sends it to the Central Servers.
-
PortaSwitch Server – This server’s functions are displayed via a variety of indicators. PortaSwitch Servers continually send information from all of the different indicators to the Configuration server.
Figure 1-1 – PortaOne NSCA-based monitoring
Very often data from one indicator is not sufficient for deciding whether the system is functioning correctly or not. Consequently, it is necessary to gather and analyze information from many different indicators to make a decision regarding relevant output. For this reason, decisions are made and enacted upon the Central Servers, since they collect and store all of the data from all of the PortaSwitch Servers. The Central Servers assign the status for each indicator:
-
OK – advises that the system is functioning correctly;
-
Warning – warns about any type of abnormality in order to prevent system failure;
-
Critical – informs that urgent intervention is needed for service outage or other failure prevention.
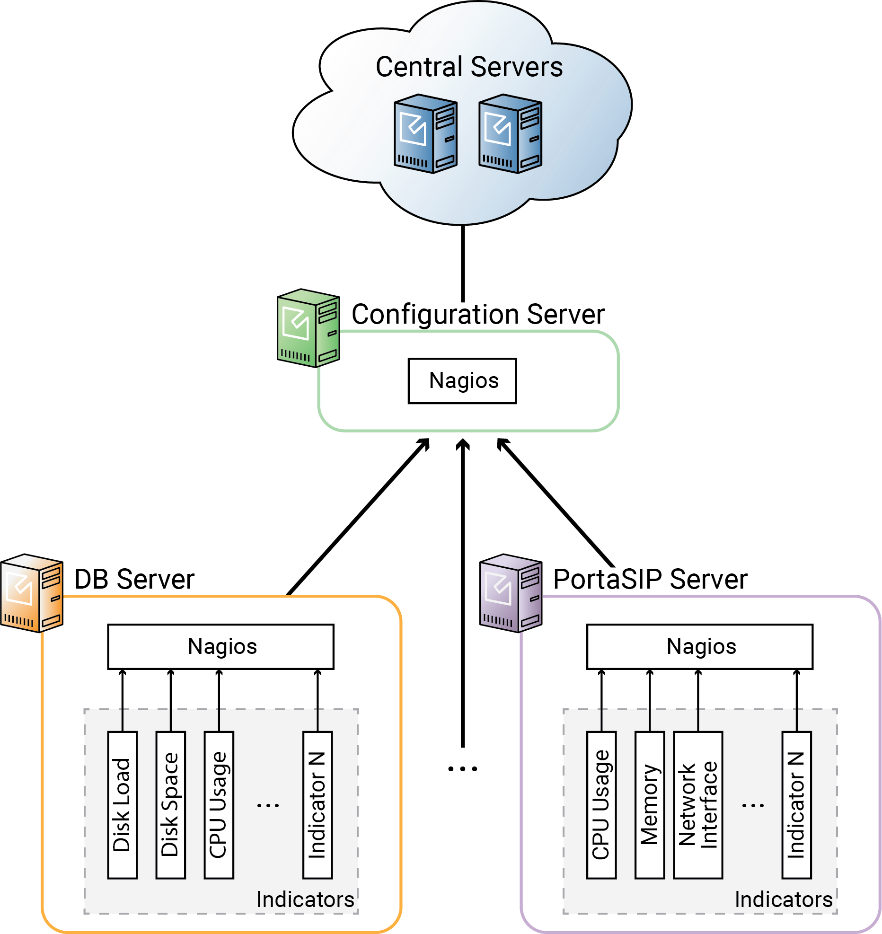
In order to transfer data from the indicators to the Central Servers, all of the PortaSwitch Servers send data to the Configuration server via the private LAN segment. The interaction mechanism is the following (Figure 1-2):
-
Checks take place once per minute.
-
Nagiosgathers check results.
-
NSCA-Client sends the results to the NSCA-Server.
- Nagios goes back to waiting mode.
Figure 1-2 – Nagios monitoring scheme
Data from each indicator is sent separately. The Configuration server itself does not send requests to the PortaSwitch Servers; it only passively receives the monitoring results. The main function of the Configuration server in this process is to reduce the load on the Central Servers. Therefore, it does not send each momentary instance of data continually, but rather, accumulates the data to send in bulk. When data from 20 indicators has been gathered, it is sent to the Central Servers within one single transaction. Similar to that of the Configuration server, the Central Servers do not send requests but instead, passively receive the monitoring results. When the results are received, the Central Servers assign a status – OK, Warning or Critical – to each indicator, and generates reports and statistics graphs.
Aside from collecting data from the PortaSwitch servers, the PortaOne supervision system monitors data transportation. Nagios scripts collect data from each indicator once per minute. If, for example, a last message from a PortaSwitch server is received more than three minutes previous or the data obtained by a Nagios script appears critical, Nagios will automatically generate a “Critical” status.
If, for example, PortaSwitch is installed across multiple sites but due to a power outage, the servers at the main site became unavailable, the “stand-alone” mode is automatically activated on the secondary site so the secondary site provides services to end users. Nagios on the Central Servers detects that data from the primary site servers is not reaching it and informs the PortaOne support team that urgent intervention is needed. The PortaOne support team immediately contacts the customer’s team to addresses the issue. Once the primary site becomes available again, the PortaOne support team makes sure that all servers are functioning normally and that all corporate services are being correctly provided.
The PortaOne support team works 24/7 to assure that customers’ installations are continually being monitored and supported even when the customers’ own engineers are not in the office.
PortaOne NSCA-NG-based monitoring
Companies have different security policies. For example, some companies forbid connections from being established between their internal network and outside Internet hosts. This makes it impossible to send data being monitored from PortaSwitch servers to the PortaOne monitoring system.
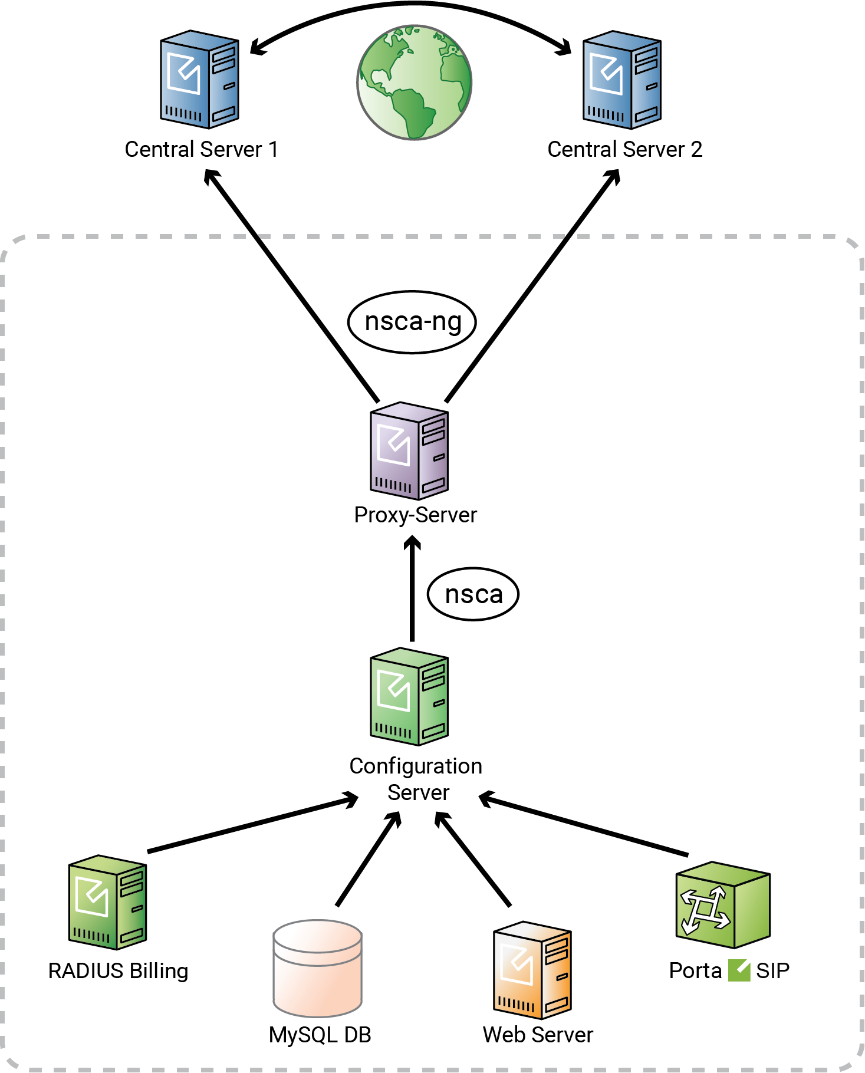
One solution we’ve come up with is to include an intermediate server within the company’s DMZ zone. This was developed to resolve this issue, in particular (Figure 1-3). This server will proxy the data that’s being monitored. The solution is based on the NSCA-NG package, which uses TLS encryption and shared-secret authentication, satisfying additional security rules.
Figure 1-3 – PortaOne NSCA-NG-based monitoring
The process unfolds similarly to PortaOne NSCA-based monitoring. The differences begin when the Configuration server sends data to a customer’s Proxy-Server instead of to the PortaOne Central Servers. The NSCA-server installed on the Proxy-Server receives the data and transforms the NSCA packages into NSCA-NG packages. The NSCA-NG client sends data that’s encrypted with a secure password through the TLS protocol to the PortaOne Central Servers.
Configuration
The PortaOne monitoring system is supplied with a PortaSwitch installation with default settings. The PortaOne support team can adjust these settings as part of the post-install procedure. The monitoring system installation does not require any effort from the customer – unless they wish to take part in settings adjustment. Before adjusting the settings, discuss your intended changes with PortaOne support so they can continue to respond to any emergency in your system in time.
The list of all indicators’ names and definitions can be downloaded from here.


