The trace session utility allows you to determine the characteristics of a specific call when you know the rate pattern (destination), which may be specified exactly, or using a wildcard. (For example, all calls to England may be specified as “44%” in the rate pattern field). A date range for the search must be specified; however, it is highly recommended to set it to the smallest range necessary, in order to reduce waiting time and server load. Ideally, the search window should contain one day only.
To initiate a query, click the Search Sessions button. If no results appear, try broadening the query. When the results appear, locate the desired call within the result set. If there are too many results, they will be divided across pages, although in this case it is advisable to narrow the query.
The result listing will show the origination number, the number dialed, the destination location, connect and disconnect times, duration, account and customer (in the case of product usage), vendor (in the case of normal vendor termination), and the call status while disconnecting, which is color-coded according to the table below. Select the View ![]() icon to go to a detailed page describing the call.
icon to go to a detailed page describing the call.
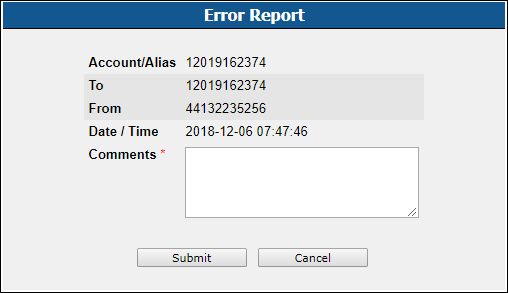
Error Report
Customer Care Staff is provided with ability to submit error reports which will be sent to correspondent mailing list set up by system administrator. Click icon to enter the Error Report screen.
In order to submit the report, Customer Care operator must fill in the Comments field describing the error details.
List of possible Disconnect reasons:
|
Reason |
Color |
|
Reason |
Color |
|---|---|---|---|---|
|
Normal completed call |
Calling side error |
|||
|
Normal uncompleted call |
Called side error |
|||
|
Call progress code |
Network error |


