Entire system load
These statistics are accessible from the Dashboard page as a widget.
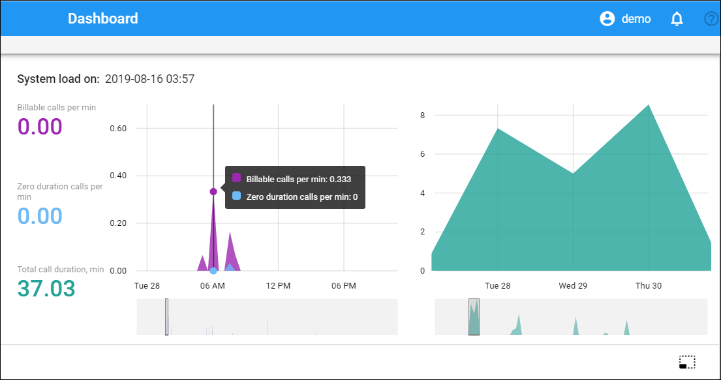
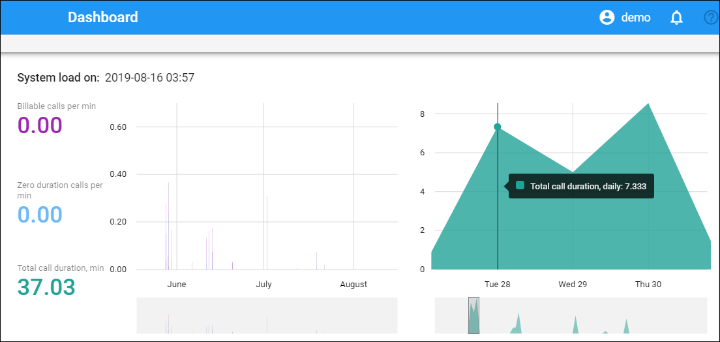
This widget includes two graphs. The left-hand graph shows the number of calls registered by a production system every 15 minutes: normal calls with duration >0 and calls with zero duration. The right-hand graph shows the total call duration.
The data on both graphs is collected for the last three months. To view the statistics for the particular time interval, select it from the bottom scale.
Number of calls
If the disconnect time on the CDR does not fall within the past 15 minutes, the call may not be finished, and hence will not be reflected on the graph.
Zero duration calls
The graph can also show possible problems in the system, such as an unexpectedly high number of failed calls.
By default, this graph displays statistics for the last 30 hours.
Total minutes statistics
The graph below gives you the ability to monitor how the call volume in your system changes each day.


