SIP status
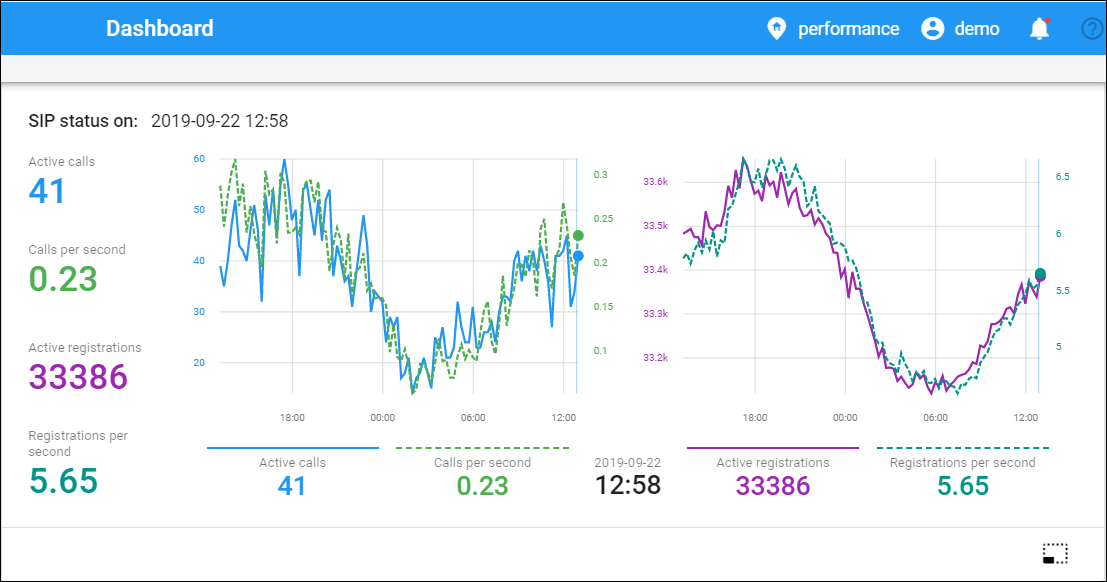
You can view statistics about the SIP services you provide for the past 24 hours. This helps you to detect changes in your network (e.g., a burst of registrations) and respond to them accordingly. The statistics includes information about calls and registrations. There are four metrics:
- the number of active calls;
- the number of calls per second;
- the number of registered UAs;
- the number of registrations per second.
They are available as the SIP status widget on the Dashboard page.
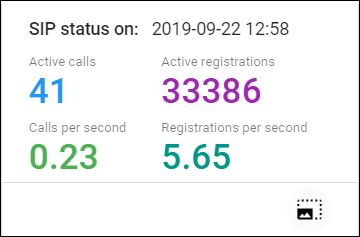
To measure statistics, enable the Metrics.StorageEnabled option on the Configuration server. The measurement frequency is 15 minutes. The date and time of the last measurements are shown at the top of the widget. The SIP status widget has both collapsed and extended views. In the collapsed view, only the last measured data is shown.
The extended view also includes charts where you can see statistics for an exact timestamp during the last 24 hours. There are two charts: the left-hand one shows statistics for calls and the right-hand chart – for registrations.
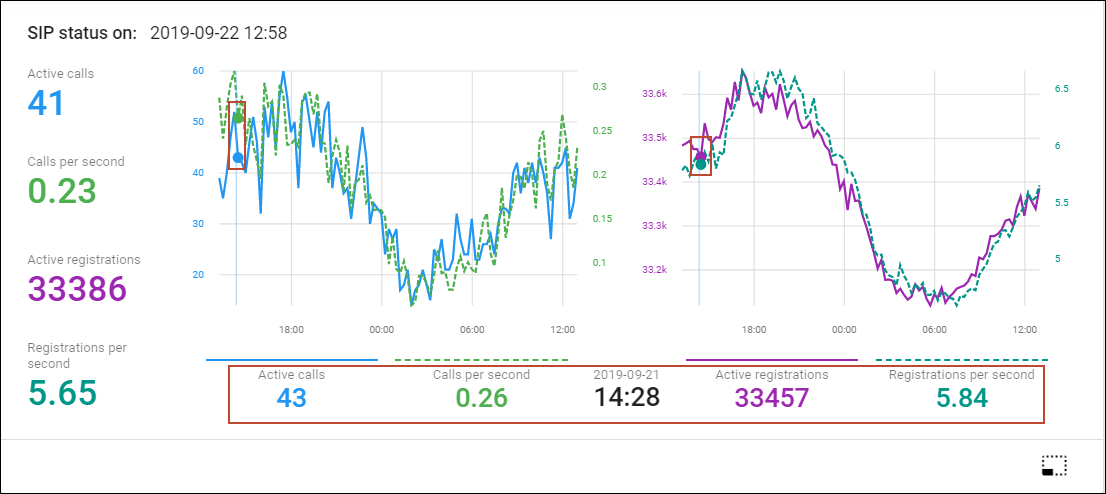
The figures below the charts show the metrics’ values for an exact timestamp. The timestamp is placed between the charts. When you highlight a specific time on one of the charts, the same time is highlighted on the second chart and the values below the charts change.
Connection load
You can monitor load and quality parameters for individual connections. To see a list of the available connections, follow the Connections link from the Toolbox section in the main menu.
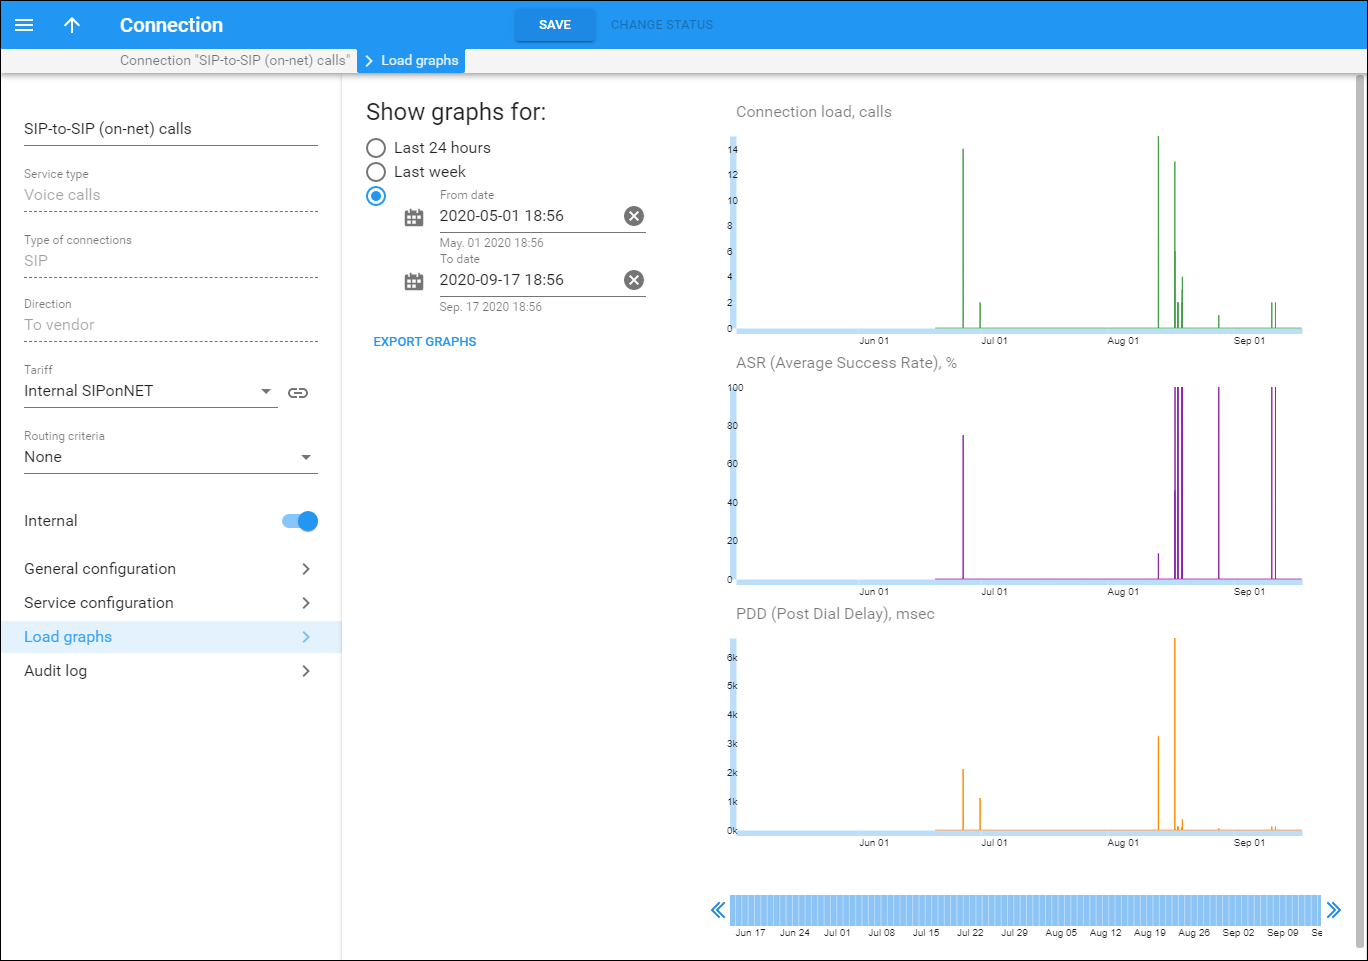
After you select a particular connection, click Load graphs to see its load graphs:
The graphs show the node load, setup time and ASR (Average Success Rate) statistics.
Connection load calculations
The connection load is calculated in 15-minute intervals (by default) as the number of calls that started and finished within the interval. This number also includes failed calls that have “zero duration.”
For example, once a 15-minute interval ends, the system calculates that your customers made 100 successful calls and 5 failed call attempts (e.g., no answer) within that interval. On the Load graphs panel, you can see that the connection load is 105 for this interval.
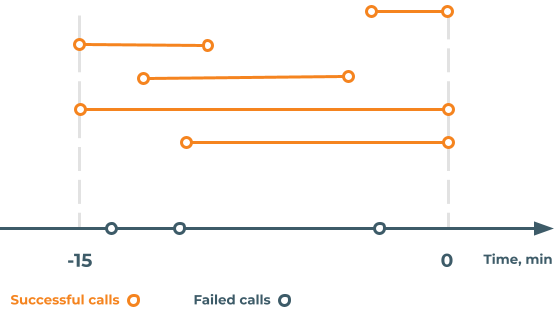
For a better understanding of the calculations performed, consider the following diagram:
Two different call types are recognized in the above diagram in the 15-minute interval:
- Number of calls that started and finished within the interval.
- Number of failed calls that have “zero duration”.
The diagram shows that during the 15-minute interval, customers made five successful calls. However, three other calls failed. The connection load is calculated as the sum of the number of all call types, making it eight calls (5+3) in total.
ASR calculations
ASR is calculated as the number of connected calls divided by the total number of calls. The result is shown as a percentage value (multiplied by 100).
Let’s say, customers made 15 calls in total. Ten of them were successful. ASR is calculated as 10/15=0.67*100= 67%.
Average setup time calculations
Average setup time is used to monitor vendor connection performance because high setup time leads to unhappy customers. The average setup time for calls is calculated as the total setup time of all calls divided by the number of these calls.
The setup time includes the time for the call initiation, routing, and signaling before any audio feedback, e.g., a ringback tone or a custom announcement. The setup time can vary depending on the quality and type of network, the technology being used (e.g., VoIP), and the complexity of the call setup process.
For example, during the 15-minute interval, there were 100 successful calls (the total setup time is 650 sec) and 5 failed calls (the total setup time is 50 sec), which made 105 calls in total. To calculate the total setup time of all calls, first, calculate the average setup time for two types of calls:
- Successful calls – 650 sec (total setup time)/100 (number of calls) = 6.5 sec
- Failed calls – 50 sec (total setup time)/5 (number of calls) = 10 sec average setup time of all failed calls.
Then the average setup time of all calls will be (6.5+10)/2=8.25 sec.
Vendor ASR statistics
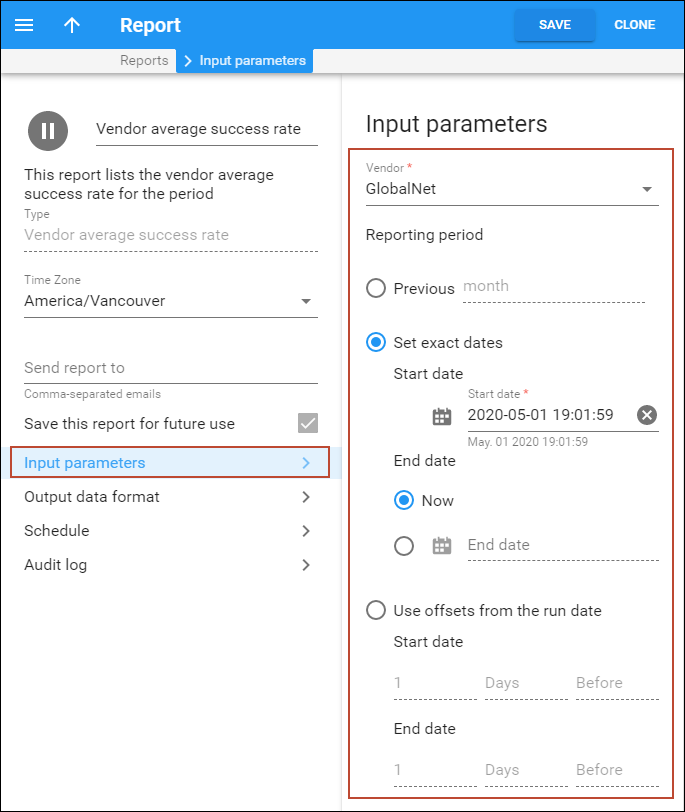
You can obtain the vendor ASR statistics for a specific time period by executing the Vendor average success rate report.
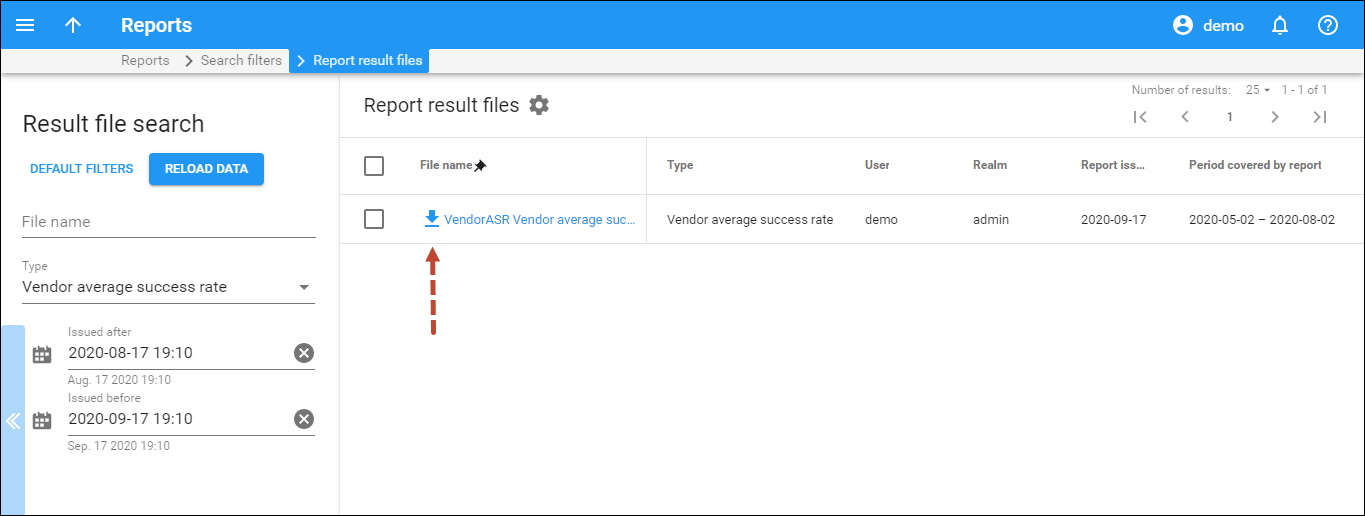
Download the report results in a .csv file.
The ASR statistics look as follows:
The data available is:
- Total number of calls.
- Number of calls with a non-zero duration (successful transactions).
- ASR rate.
- Total call duration (used quantity).
- ALOC (Average Length of Call).
The values are aggregated per destination prefix, with a subtotal per country and a total for all calls.


