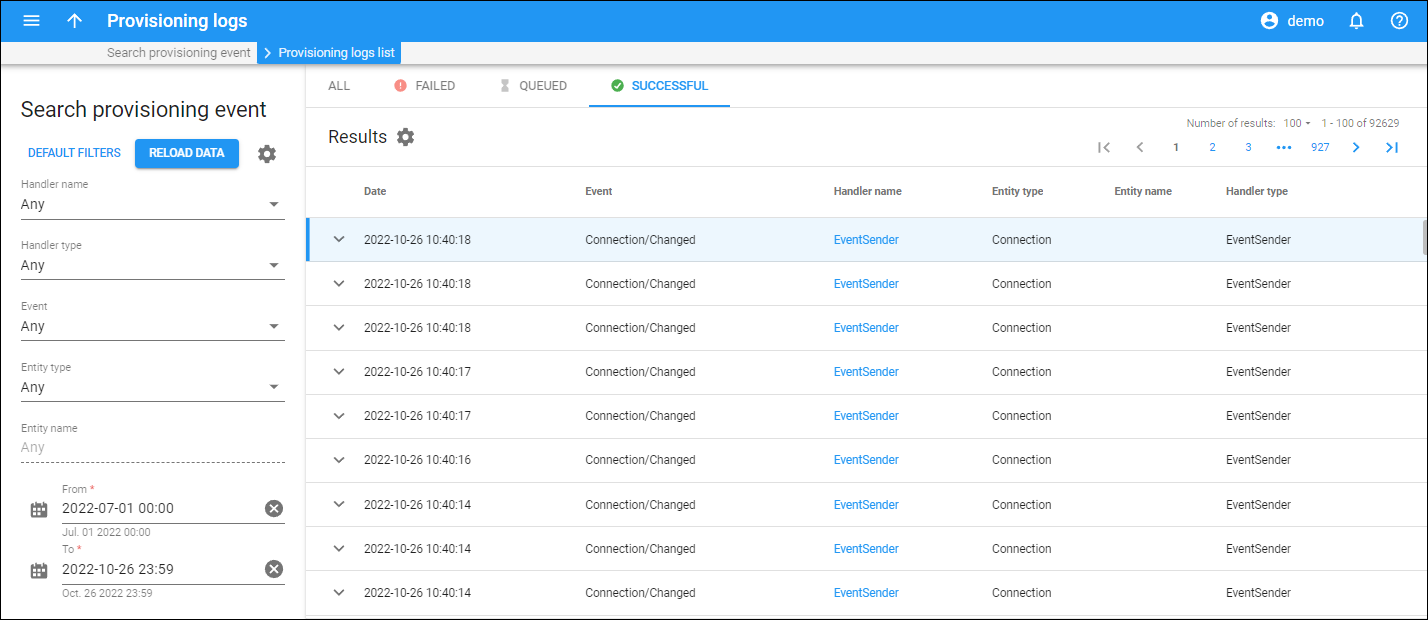
This panel displays the list of provisioning logs for specific events (e.g., a new account is created) with the corresponding status.
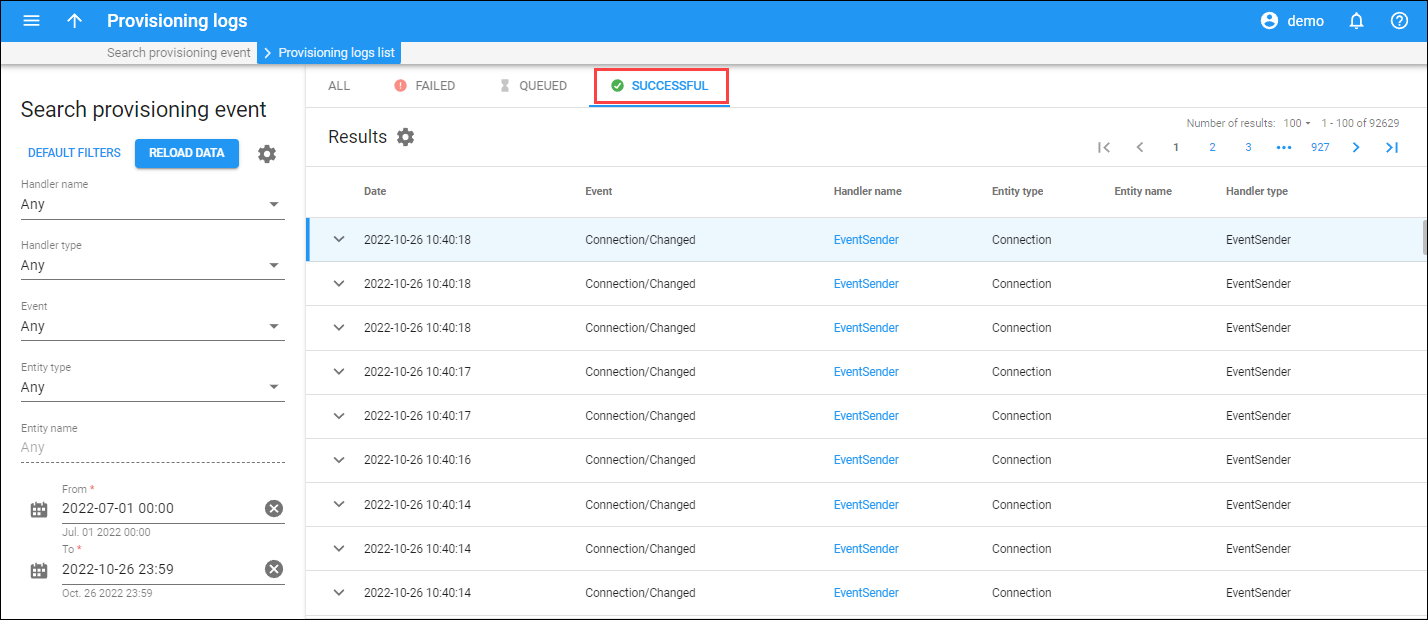
You can switch between the tabs to see the list of provisioning logs for events:
- All – with any status.
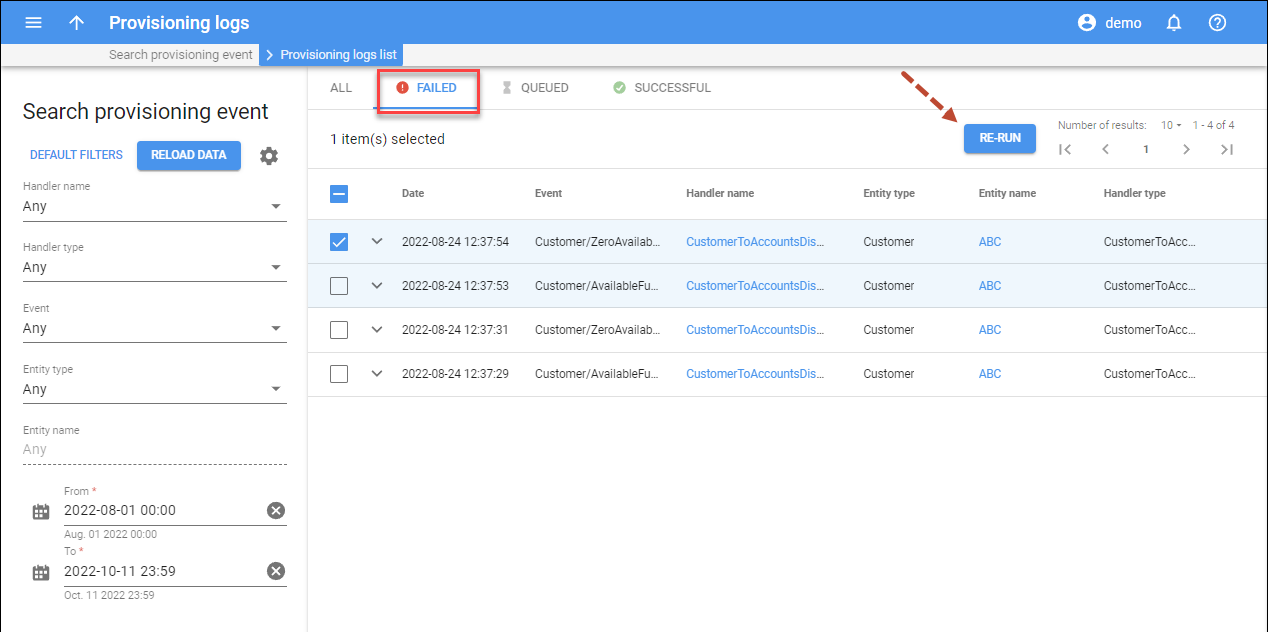
Failed – the events with “Failed” provisioning status (an issue occurred during event provisioning). You can re-start the provisioning for such events. For this, select all or specific events in the list and press Re-run.

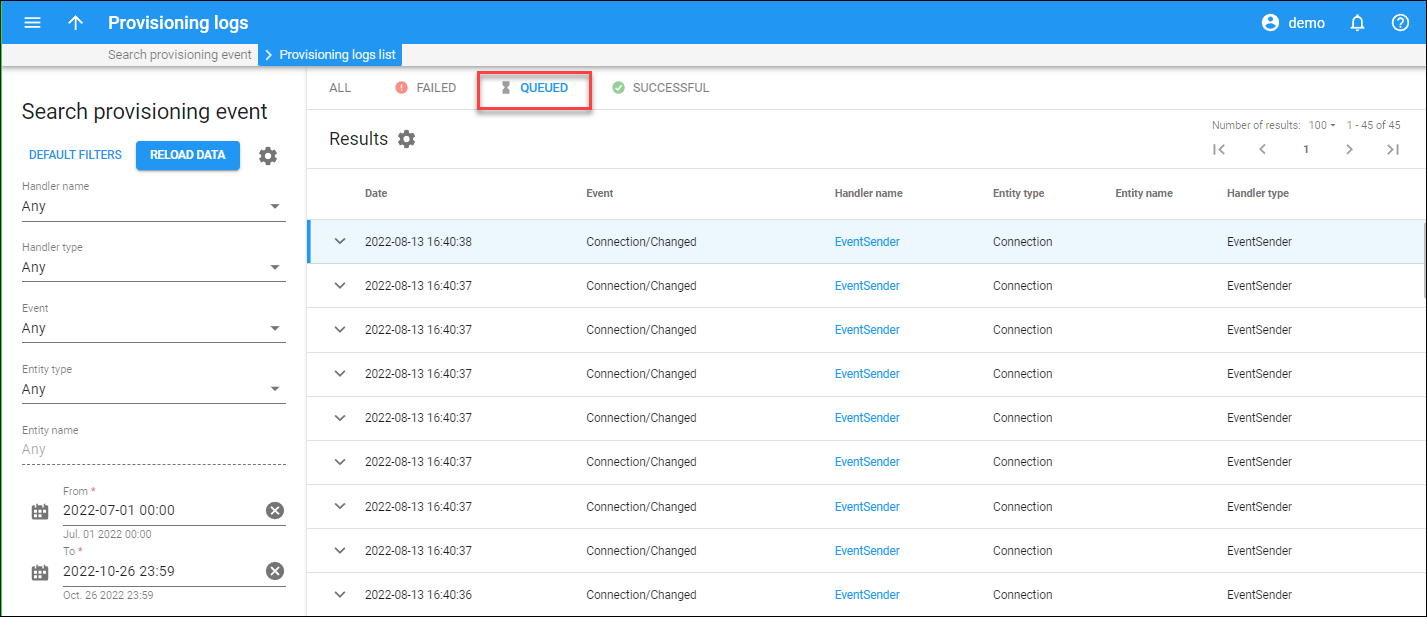
Queued – the events queued in the system.

Each entry in the list of provisioning logs consists of:
Status
The icon indicates the provisioning status of the event.
Date
The exact date and time of the event. The event provisioning logs are displayed in chronological order.
Event
The name of the event, e.g., Account/Blocked.
Handler name
The name of the used event handler. This is also a link that redirects you to the corresponding Event handler page.
Entity type
The type of entity the event is related to.
Entity name
The specific entity the event is related to. This is also a link that redirects you to the corresponding entity page.
Handler type
The type of the event handler used.
Customize the panel
- Change table settings – click Settings
in the title bar to customize columns and change row style.
- Re-order the columns – drag-and-drop the column headers right or left to place the columns in the order you want.
- Change the default number of results globally – use the Number of results dropdown list in the upper right corner to adjust the maximum number of rows that appear on the panel. By default, the panel displays 25 rows. Once the number is changed, it’s automatically saved, so the same number of rows is shown for PortaBilling entities, e.g., customer, account, reseller, etc.


